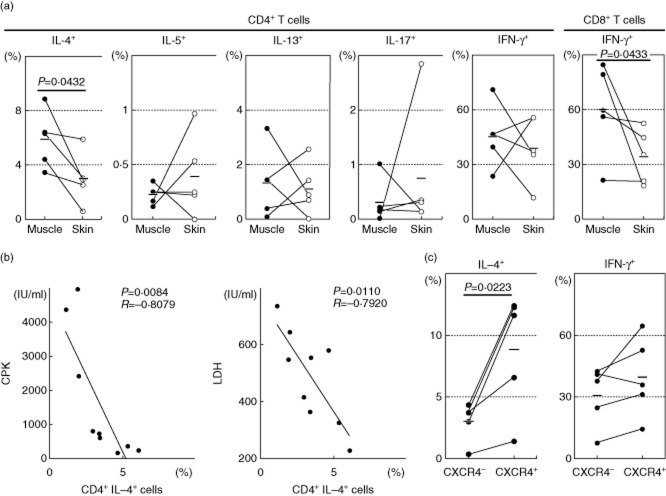
Fig. 5.
Intracellular cytokine expressions of muscle- and skin-infiltrating T cells in the patients (n = 5). (a) The percentage of cytokine-producing T cells as assessed by intracellular cytokine staining and flow cytometric analysis (FCM). Horizontal bars indicate mean values. (b) Correlations between the percentage of interleukin (IL)-4-producing CD4+ T cells and clinical parameters (n = 9). (c) IL-4 and interferon (IFN)-γ expression by chemokine (C-X-C motif) receptor (CXCR)4-positive or negative CD4+ T cells (n = 5).

