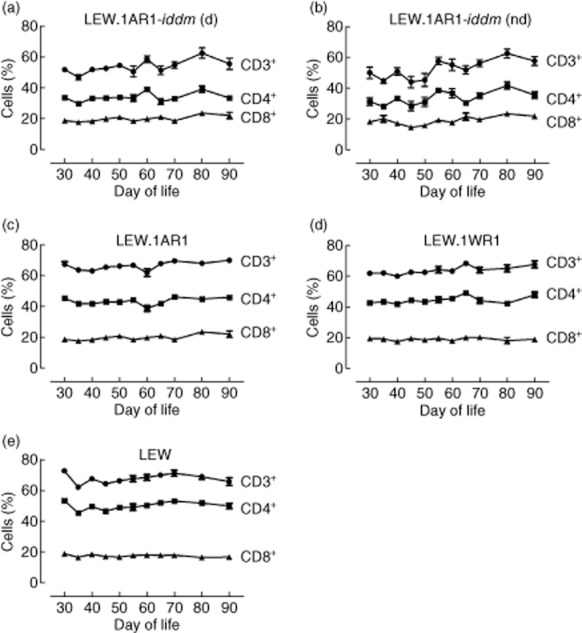
Fig. 4.

T cell frequency in different rat strains over time from days 30 to 90 of life. The CD3+ T cell frequency as well as the CD4+ and CD8+ T cell frequency was measured in the different rat strains. For each time-point a mean value ± standard error of the mean (s.e.m.) was calculated for each group. Diabetic and non-diabetic LEW.1AR1-iddm rats showed strong variations in the T cell frequency over the lifetime (a,b). The background strain LEW.1AR1 showed only little variation in the T cell frequency, with a strain-dependent decrease of CD3+ and CD4+ T cells at day 60 of life (c). The LEW and LEW.1WR1 strain showed only slight variations in T cell frequency over time (d,e). (d) = diabetic, (nd) = non-diabetic.
