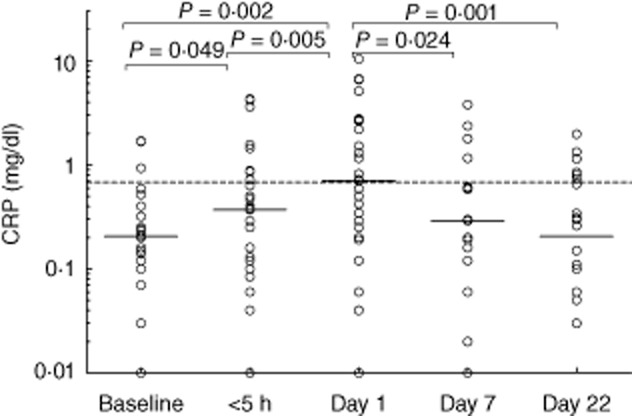
Fig. 2.

C-reactive protein (CRP) levels before, during and after an attack in hereditary angioedema (HAE) patients with an abdominal location of the attack. Solid lines indicate the median in each group. The dotted line shows the mean upper level of normal as used by the laboratories which performed the determinations. The differences between levels at various time-points were analysed with Wilcoxon's paired-sample test (two-sided P-value).
