Fig. 5.

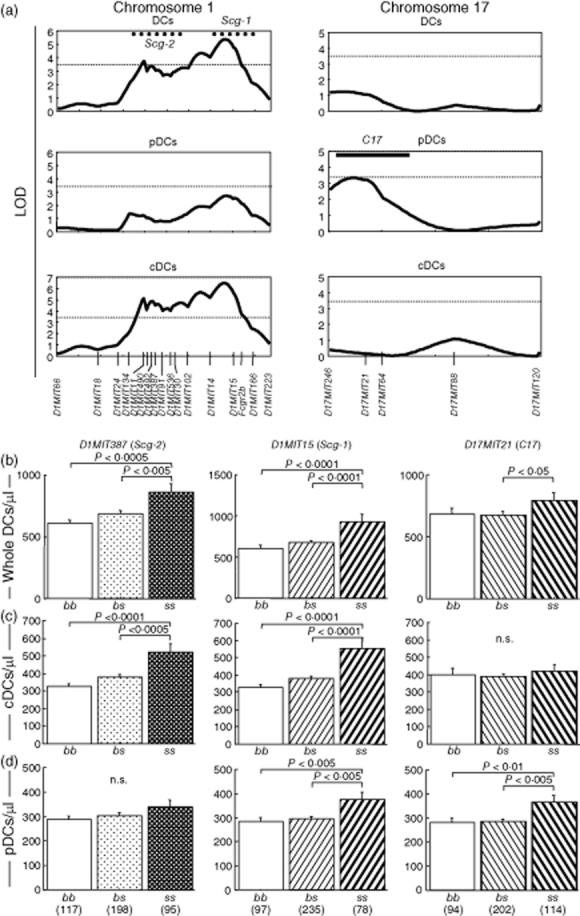
Two quantitative trait loci (QTLs) on chromosome 1 linked to increase of conventional DCs (cDCs) in peripheral blood, and one QTL on chromosome 17 linked to that of plasmacytoid DCs (pDCs). (a) Genome-wide scan using MapManager QTX identified one QTL represented by D1MIT15 and the other represented by D1MIT387 on chromosome 1, and one QTL represented by D17MIT21 on chromosome 17. 10-based logarithm of odds (LOD) scores calculated with MapManager QTX are shown. Dotted horizontal lines indicate significant LOD threshold values determined by permutation tests. Previously described spontaneous crescentic glomerulonephritis-forming/Kinjoh (SCG/Kj)-derived QTLs (Scg-1 and Scg-2) and their 1-LOD-supported intervals 8 are shown by bold dotted lines. The 1-LOD interval of C17 was determined by the LOD curve for Gr-1+ cells (see Fig. 6) and shown by bold horizontal line. (b–c) QTLs for increase of whole DCs (b), cDCs (c) and pDCs (d) in peripheral blood were inherited in a recessive manner. BSF2 mice grouped according to genotypes of D1MIT15 (Scg-1), D1MIT387 (Scg-2) and D17MIT21 (C17) were compared using analysis of variance (anova). P-values in Fisher's protected least significant difference procedure are shown; n.s. = not significant. Numbers of mice are shown in parentheses.
