Fig. 6.

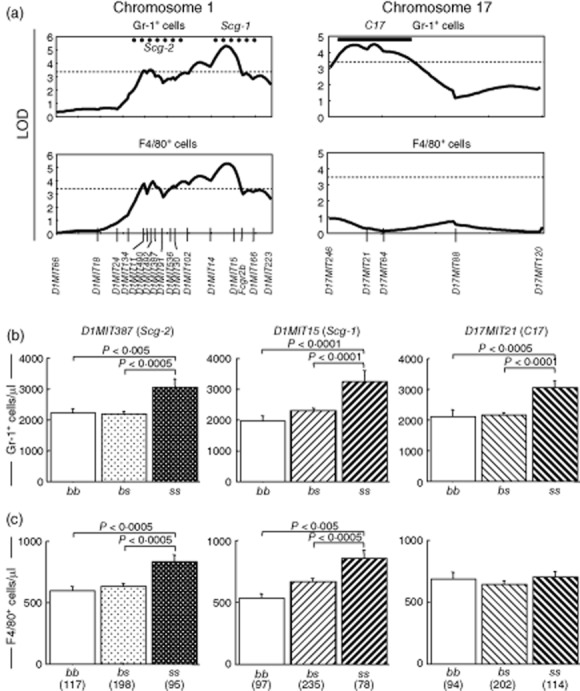
Quantitative trait loci (QTLs) represented by D1MIT15, D1MIT387 and D17MIT21 also influenced increase of granulocytes (D1MIT15, D1MIT387 and D17MIT21) and macrophages/monocytes (D1MIT15 and D1MIT387) in peripheral blood. (a) MapManager QTX scan to identify QTL(s) linked to increase of granulocytes and macrophages/monocytes. The pattern of the logarithm of odds (LOD) curve on chromosome 1 was similar to that of conventional dendritic cells (cDCs) (Fig. 5). The QTL on chromosome 17 for granulocyte increase was represented by D17MIT21, and its 1-LOD support interval defined C17. Spontaneous crescentic glomerulonephritis-forming/Kinjoh (SCG/Kj)-derived intervals (Scg-1 and Scg-2) and significant LOD threshold values determined by permutation tests are shown as Fig. 5. (b) QTLs for granulocytosis on chromosomes 1 and 17 were inherited in a recessive manner. (c) Mode of inheritance of QTLs for increased F4/80+ cells was similar to those of granulocytes and increase of cDCs. There was no QTL for monocytosis on chromosome 17. Analysis of variance (anova) was performed and P-values are shown in the same fashion as Fig. 5. Numbers of mice are shown in parentheses.
