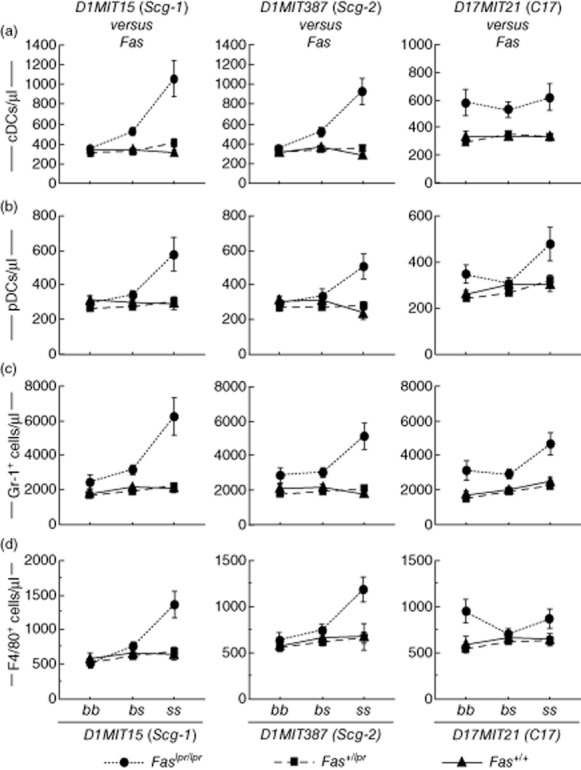
Fig. 8.

Characterization of interactions between Fas and three non-Fas quantitative trait loci (QTLs). BSF2 mice were classified by Fas genotypes and further classified by genotypes of any one from non-Fas QTLs. Mean values ± standard error of the mean are shown are shown.
