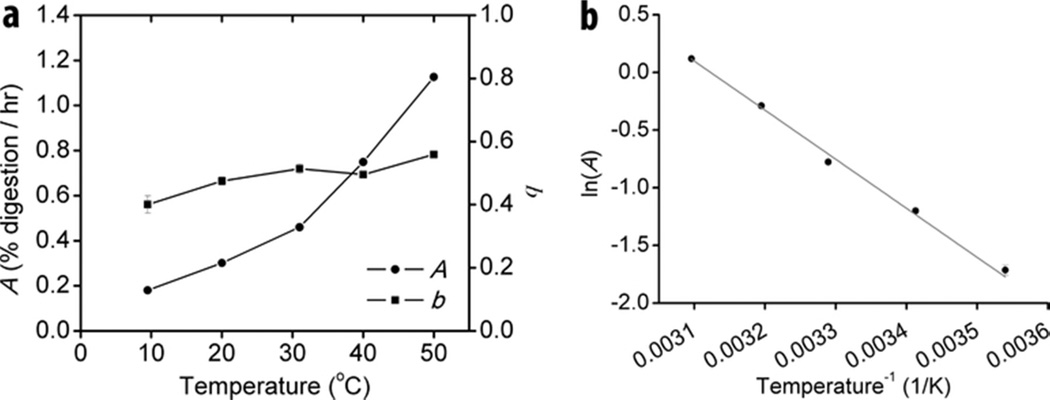
Figure 2.
Dependence of A and b on temperature. (a) Experimentally determined A and b values for TfCel9A digestion of BC at different temperatures; (b) Arrhenius plot of A. A time course profile was obtained for each temperature (N=3) and the data were fit with Eqn. 6 to obtain A and b values. Error bars represent standard error of the fit.

