
Figure 2.
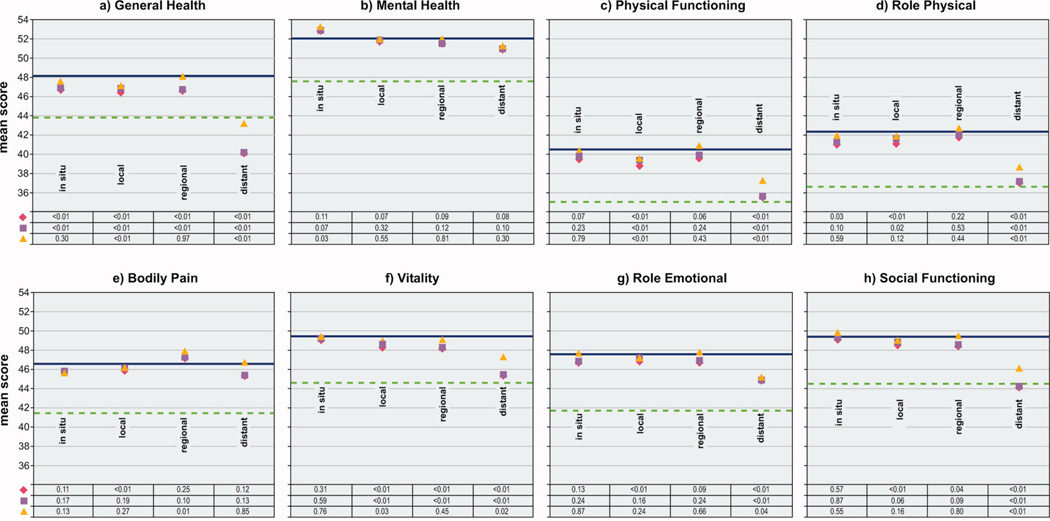
Comparison of mean scores for eight SF-36 scales among women with and without cancer, by cancer stage, Iowa Women’s Health Study, 2004
| Values below each graph represent p-values for the difference in mean QOL scores between women with cancer compared to women without cancer |
 Unadjusted, all women Unadjusted, all women |
 Age- and comorbidity-adjusted, all women Age- and comorbidity-adjusted, all women |
 Age- and comorbidity-adjusted, excluding cancer survivors with second primary cancer or reporting cancer treatment in 2004 Age- and comorbidity-adjusted, excluding cancer survivors with second primary cancer or reporting cancer treatment in 2004 |
 mean score for women without cancer mean score for women without cancer |
 1/2 standard deviation below the mean score of women without cancer 1/2 standard deviation below the mean score of women without cancer |