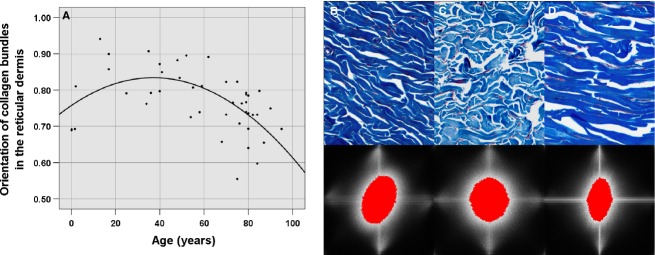
Fig. 3.

Analysis of the collage orientation in the reticular dermis with the Fourier transform. (A) Scatter plot of the collagen orientation as a function of age. Image of the collagen orientation (B) in a 19-month-old individual, with a mean of 0.6923, (C) in a 35-year-old subject, with a mean of 0.9067 and (D) in a 76-year-old individual, with a mean of 0.7073.
