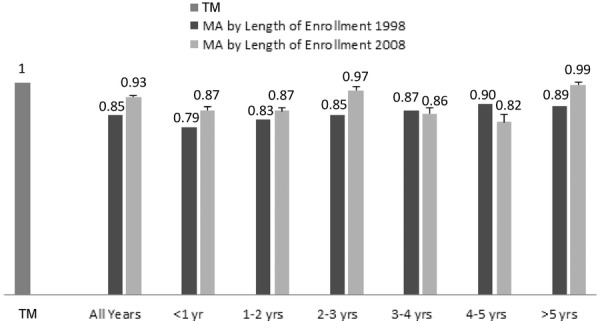
Figure 7.

MA Mortality/TM Mortality, by Length of Enrollment in MA, 1998, 2008
Reproduced with permission from Health Affairs.46 Rates are adjusted for age, gender, and Medicaid status. For the TM group, anyone who was in MA at any point in 2003-2008 was excluded, and for the MA group, anyone who switched to TM in 2008 was excluded, except for MA enrollees who elected hospice in 2008 and were shown as in TM after that election (this group comprised 2% of MA enrollees who elected hospice). If the latter group is excluded, the 2008 rate for all years would drop to 0.92, the less-than-1-year rate to 0.85, and the more-than-5-year rate to 0.98. The bars above the 2008 rates are the upper limit of a 95% confidence interval. MedPAC did not compute confidence intervals for the 1998 mortality results, so we could not test formally for differences, but Part C enrollment in 1998 was 6 million versus 9.9 million in 2008. TM enrollment was slightly smaller than in 2008. Adjusting for the difference in sample size and the drop in the elderly's mortality rates between 1998 and 2008, confidence intervals in 1998 are about 30% larger than in 2008. Using this value, the mortality differences between 1998 and 2008 for all Part C enrollees, as well as for almost all the other differences shown, are significant at standard levels of significance.
