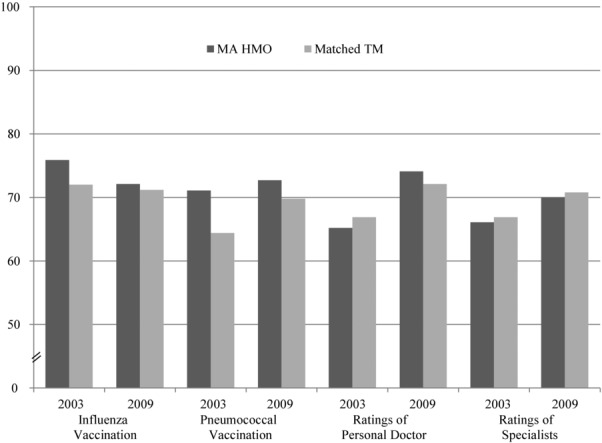
Figure 10.

Quality of Care on CAHPS Measures for MA HMOs Matched to TM Beneficiaries in 2003 and 2009 (% receiving or beneficiary ratings on 0-100 scale)
Reproduced with permission from Health Affairs.57 HMO and TM enrollees in counties were matched by age, sex, and race/ethnicity self-reported health status and were weighted by enrollment in MA HMO plans to derive national estimates with 2-tailed p values for each measure by study year. CAHPS measures were not collected for MA HMO enrollees in 2006 or for TM enrollees in 2005 or 2006, and response rates were relatively low for both groups in 2007. For ratings of personal doctor and specialists, proportions represent ratings of 9 or 10 on a 0-10 scale. Two-sided p-values are shown.
