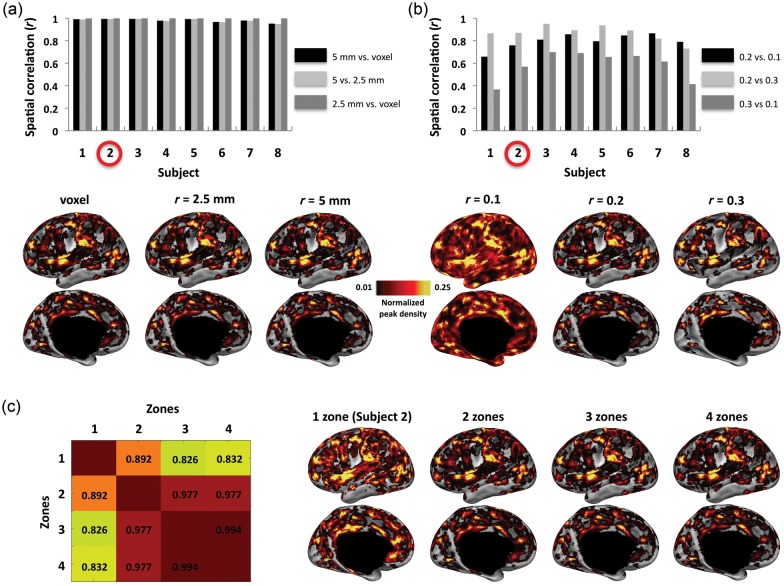
Figure 5.
Many of the features of the RSFC-Snowballing aggregate peak density map are similar across a range of parameter settings. (a) The size of the seed ROI (a single voxel vs. a 2.5-mm radius ROI built around the voxel vs. a 5-mm radius ROI built around the voxel) used throughout RSFC-Snowballing had minimal impact on the peak density maps. An illustrative subject's (subject 2) aggregate peak density maps are displayed below the bar plot. (b) Similarity in the aggregate peak density maps was more variable when examining the impact of different correlation thresholds for neighbor identification. The aggregate peak density maps following more stringent thresholds (r > 0.2 and r > 0.3) were more similar than the aggregate peak density maps produced using each of these thresholds relative to the aggregate peak density map produced using a lower threshold (r > 0.1) across the majority of subjects. An illustrative subject's (subject 2) aggregate peak density maps are displayed below the bar plot. (c) A single subject's data are displayed to demonstrate the similarity in aggregate peak density maps following a variable number of zones of RSFC-Snowballing. Aggregate peak density maps were created following 1–4 zones of RSFC-Snowballing, and the spatial similarity of the maps was computed between the 4 independent analyses (spatial correlation r values in matrix). The similarity of peak density maps appears to asymptote following 3 zones of RSFC-Snowballing (left; i.e., compare similarity following 4 zones of RSFC-Snowballing with that following 1, 2, and 3 zones of RSFC-Snowballing). This observation can be further appreciated by examining the distribution of peaks across the number of zones of RSFC-Snowballing on the subject's left hemisphere (right). All peak density maps are normalized and thresholded (1%) relative to the maximum peak value to facilitate viewing, and are displayed on the subject's inflated cortical surface.

