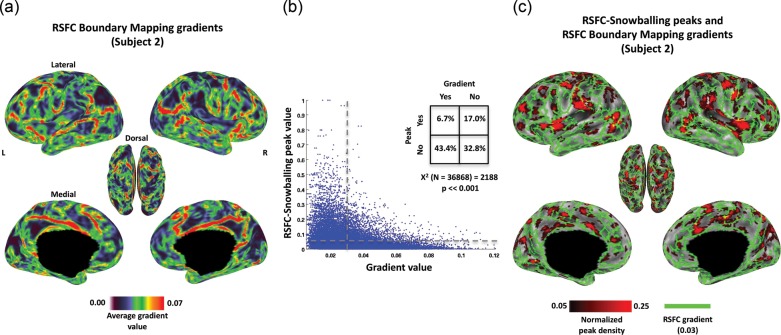
Figure 9.
Peaks defined by RSFC-Snowballing are surrounded by gradients defined by RSFC-Boundary Mapping in an illustrative subject. (a) Voxel-wise distribution of mean gradient values defined by RSFC-Boundary Mapping reveal nonuniformity in the average gradient value (i.e., likelihood of an area boundary) across the cortical surface for an individual subject (presented on the subject's native 18K vertex surface mesh). (b) A scatter plot demonstrates the relationship between the 2 independent methods of RSFC area parcellation. As an additional illustration of the correspondence, dashed lines indicate the thresholds applied to compute the chi-square test for independent samples (inset), and the corresponding map of these thresholded values is depicted in (c). Voxels with high peak values as defined by RSFC-Snowballing are largely surrounded by voxels with high gradient values as defined by RSFC-Boundary Mapping, demonstrating that the 2 methods of area parcellation complement one another closely.

