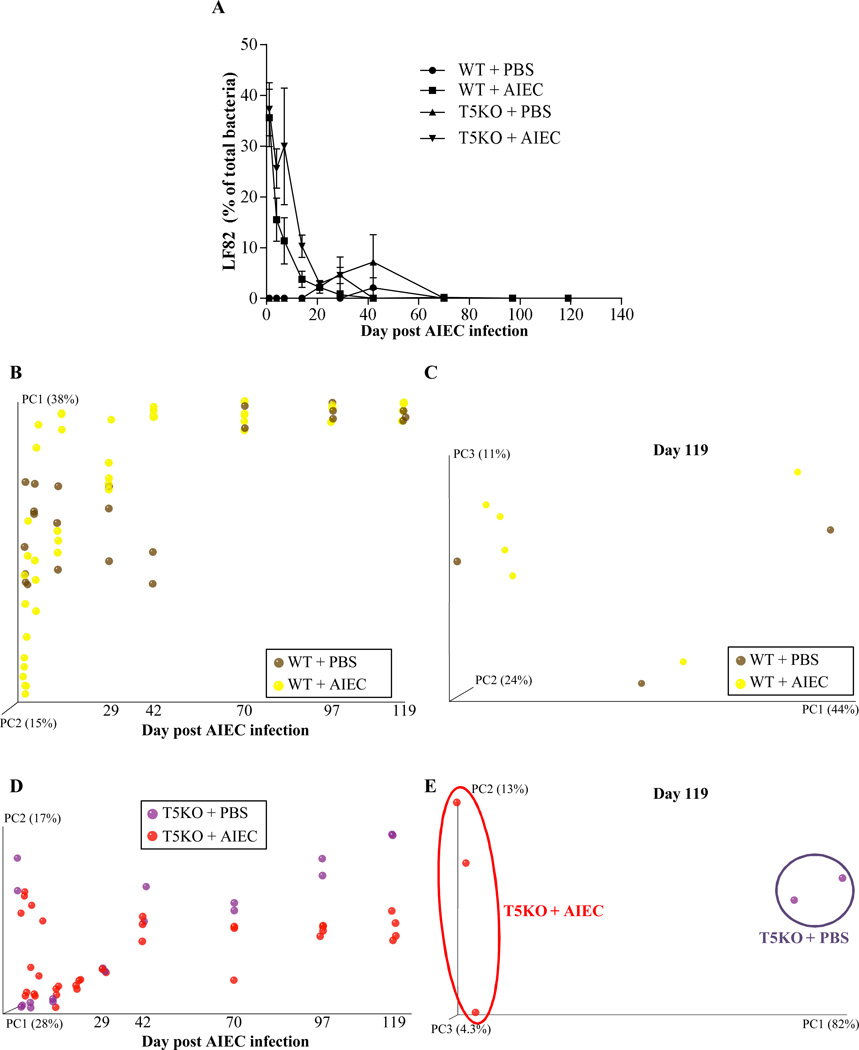
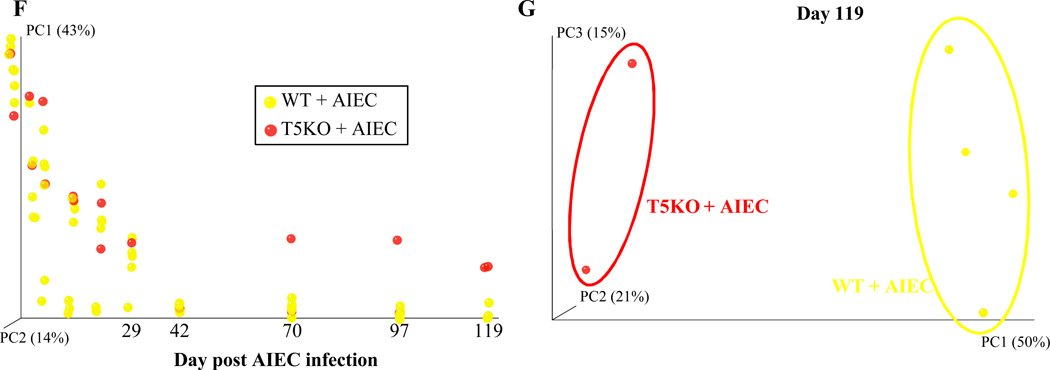
Figure 3. T5KO mice infected with AIEC displayed modified intestinal microbiota.
A. AIEC colonization were determined in WT and T5KO mice based on 454 pyrosequencing 16S rRNA analysis to determine their relative abundance in feces. Data are represented as means ± S.E.M. of N=3/5 mice per group. B. Mouse fecal bacterial communities from WT uninfected (PBS) or infected with 107 AIEC strain LF82 were clustered using principal coordinates analysis (PCoA) of the unweighted UniFrac distance matrix. PC1 and PC2 are plotted for each time point (from day 1 to day 119). The time is expressed on the X axis, and the percentage of the variation explained by the plotted principal coordinates is indicated in the Y axis labels. C. Mouse fecal bacterial communities from WT uninfected (PBS) or infected with 107 AIEC strain LF82 were clustered using principal coordinates analysis (PCoA) of the UniFrac unweighted distance matrix. PC1, PC2, and PC3 are plotted and the percentage of the variation explained by the plotted principal coordinates is indicated in the Y axis labels. D. Mouse fecal bacterial communities from T5KO uninfected (PBS) or infected with 107 AIEC strain LF82 were clustered using principal coordinates analysis (PCoA) of the UniFrac unweighted distance matrix (see Figure 3B). E. Mouse fecal bacterial communities from T5KO uninfected (PBS) or infected with 107 AIEC strain LF82 were clustered using principal coordinates analysis (PCoA) of the UniFrac unweighted distance matrix (see Figure 3C). F. Mouse fecal bacterial communities from WT or T5KO mice infected with 107 AIEC strain LF82 were clustered using principal coordinates analysis (PCoA) of the UniFrac unweighted distance matrix (see Figure 3B). G. Mouse fecal bacterial communities from WT or T5KO mice infected with 107 AIEC strain LF82 were clustered using principal coordinates analysis (PCoA) of the UniFrac unweighted distance matrix (see Figure 3C). H. Members of the microbiota that differ in abundance between WT and T5KO mice infected with 107 AIEC strain LF82. The heat map indicates the relative abundance of the top 13 bacterial OTU accounting for the differences between WT and T5KO mice after AIEC infection. Columns show, for each sample, the abundance data of genera listed in the right part. The abundances of the genera were clustered using unsupervised hierarchical clustering (white, low abundance; red, high abundance). The phylum (P), class (C), order (O) and family (F) of each of the classifying OTUs is noted.


