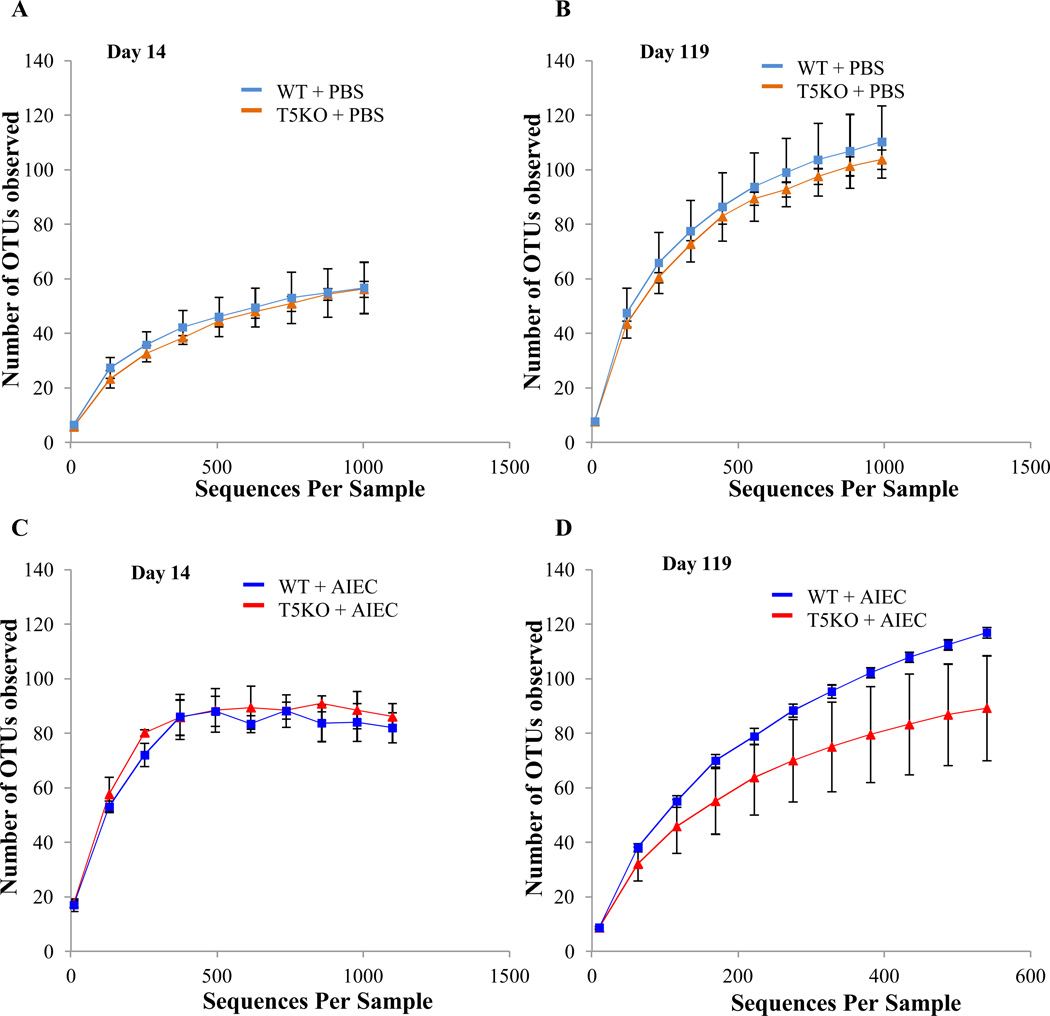
Figure 4. AIEC infection decrease the richness and diversity of intestinal microbiota in T5KO mice.
Rarefaction curves at day 14 (A–C) and day 119 (B–D) for uninfected (A–B) or AIEC infected (C–D) groups. The rarefaction curve is based on 454-based DNA sequencing of 16S rRNA gene libraries from feces and depicts the number of unique operational taxonomic units (OTUs). Data are represented as mean ± S.E.M. of N=3/5 mice per group. The slope of the line is directly related to the number of unique OTUs (i.e. increased diversity) in a sample.

