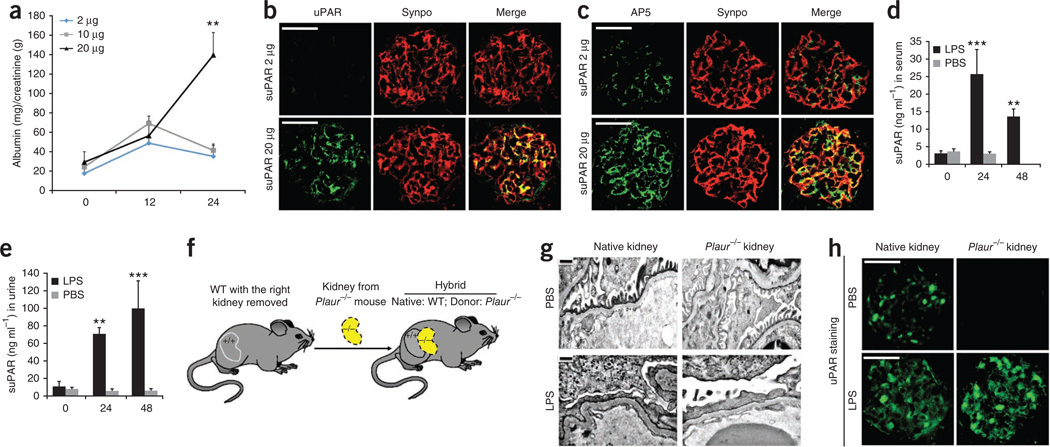
Figure 4. suPAR activates β3 integrin and causes foot process effacement in Plaur−/− mouse kidneys and albuminuria in Plaur−/− mice.
(a) Injection (i.v.) of high doses of recombinant mouse suPAR into Plaur−/− mice (n = 4 per group) induces proteinuria. **P < 0.01 for mice injected with 20 µg of suPAR at 24 h versus mice injected with other doses or versus other time points. (b) Injection (i.v.) of high doses of recombinant suPAR deposits into podocytes. Green, uPAR; red, synaptopodin (Synpo). (c) AP5 activity induced in the podocytes of high-dosage suPAR-injected Plaur−/− mice (n = 4). Green, AP5; red, Synpo. (d,e) LPS induced endogenous suPAR in wild-type mice (n = 6). (d) Serum suPAR concentrations in LPS-treated mice. ***P < 0.001 for LPS-injected mice at 24 h versus PBS control, and versus LPS-injected mice at 0 h. **P < 0.01 for LPS-injected mice at 48 h versus at 0 h. (e) Urinary suPAR concentrations. ***P < 0.001 for LPS-injected mice at 48 h versus 0 h, and versus PBS control at any time point. **P < 0.01 for LPS-injected mice at 24 h versus 0 h. (f) Generation of a hybrid-kidney mouse model. (g) Electron microscope analysis of the PBS (n = 3) or LPS (n = 5) treated hybrid kidney. (h) uPAR expression in the native or Plaur−/− kidneys from the hybrid-kidney mice with or without LPS treatment. Scale bars, 30 µm in b,c and h; 250 nm in g. Error bars, means ± s.e.m. in a; means ± s.d. in d,e.

