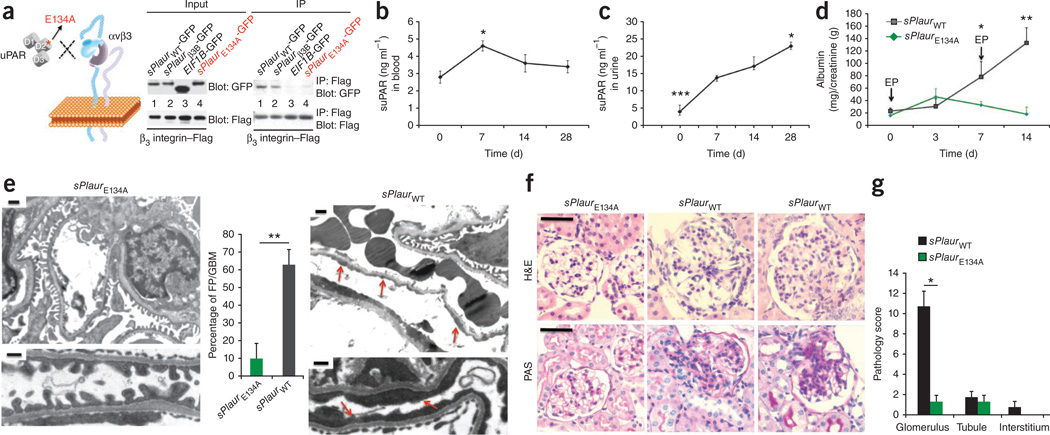
Figure 5. Sustained overexpression of suPAR in the blood of wild-type mice leads to an FSGS-like glomerulopathy.
(a) Generation of β3 integrin binding–deficient suPAR mutants. (b) Serum suPAR concentrations in the sPlaurWT engineered mice. *P < 0.05 at day 7 versus day 0 (before initial electroporation) (c) Urinary suPAR in sPlaurWT engineered mice. ***P < 0.001 for days 7, 14 and 28 versus day 0; *P < 0.05 for day 28 versus day 7. (n = 4 in each group). (d) Albuminuria in sPlaurWT and sPlaurE134A mice. *P < 0.05 for sPlaurWT mice at day 7 versus before treatment or versus sPlaurE134A mice at day 7. **P < 0.01 for sPlaurWT engineered mice at day 14 versus before treatment or versus sPlaurE134A treated mice at day 7 or 14. (e) Kidney EM analysis of sPlaur engineered mice. Podocyte damage is reflected by relating the length of effaced foot process (FP) to the total length of the glomerular basement membrane (GBM) analyzed. Scale bars, 1 µm for upper image, 250 nm for lower image. **P < 0.01. (f) Histochemistry and light microscopy of the kidney from sPlaur engineered mice. PAS, periodic acid–Schiff. Scale bars, 30 µm. (g) Histopathological alteration of the kidneys was semiquantitatively scored. *P < 0.05. Error bars, means ± s.e.m. in d; means ± s.d. in b,c,e and g.

