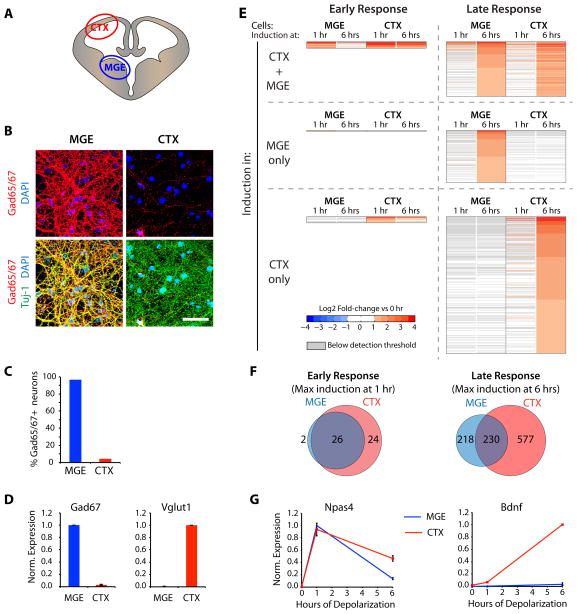
Figure 1. Activity-induced transcription in inhibitory neurons.
A–D) Separate dissection of the E14 Medial Ganglionic Eminence and cortex yield cultures highly enriched for either inhibitory (MGE) or excitatory (CTX) neurons. A) Schematic coronal cross-section of E14 brain and the regions dissected to prepare MGE- and CTX-cultures. B) DIV10 MGE and CTX cultures immunostained for Gad65/67 (red, inhibitory neuron marker) and Tuj-1 (green, pan-neuronal marker) (DAPI = blue, scale bar = 50 μm). C) Quantification of Tuj-1 positive neurons that stain positive for GAD65/67 in MGE or CTX cultures. D) qPCR-analysis for Gad67 and Vglut1 in DIV10 MGE (blue) and CTX (red) cultures (Data represented as mean ± SEM of 3 bioreps). EG) Genome-wide analysis of the gene program induced by neuronal activity in inhibitory and excitatory neurons: shared early-induced genes and cell type-specific late-induced genes. E) Heat maps showing results of the microarray analysis of membrane depolarized MGE or CTX cultures. Displayed are all probesets changing by 2-fold or more in at least one condition, each horizontal line represents the fold-changes of one probe-set. F) Venn diagrams displaying the number of probesets induced after one or six hours of membrane depolarization specifically in MGE cultures (blue), specifically in CTX cultures (red) or commonly in both types of cultures (purple). G) qPCR-analysis for Npas4 and Bdnf in DIV10 MGE (blue) and CTX cultures (red) after 0, 1, or 6 hours of membrane depolarization (Data represented as mean ± SEM of 3 bioreps). (See also Figure S1)

