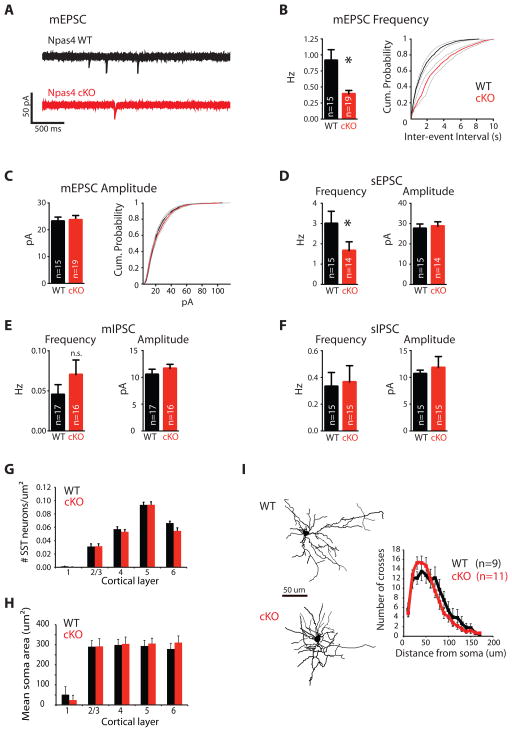
Figure 4. Npas4 regulates the development of functional excitatory inputs onto SST neurons.
A–F) Deletion of Npas4 in SST neurons reduces functional excitation but not inhibition onto SST neurons in the visual cortex in vivo. Whole-cell patch clamp recordings were obtained from tdTomato-labeled SST-neurons in acute slices of Npas4 WT (black) or cKO (red) P10-12 mice (data presented as bar graph of mean + SEM or as cumulative distribution function CDF of mean ± SEM; * = significant change, p < 0.05). A) Example traces of mini EPSCs (mEPSCs) (recorded at −70 mV in the presence of 0.5 μM TTX, 50 μM PTX and 25 μM CTZ; scale bar = 50 pA, 500 ms). B) Left, mEPSC frequency (p < 0.005, Mann-Whitney U-Test). Right, CDF of the mEPSC inter-event intervals of all neurons sampled in each genotype. C) Left, mEPSC amplitude (p = 0.847, Mann-Whitney U-Test). Right, CDF of the mEPSC event amplitudes of all neurons sampled in each genotype. D) Left, spontaneous EPSC (sEPSC) frequency (recorded at −70 mV in the presence of 50 μ M PTX; p = 0.027, Mann-Whitney U-Test). Right, sEPSC amplitude (p = 0.499, Mann-Whitney U-Test). E) Left, mIPSC frequency (recorded at 0 mV in the presence of 0.5 μM TTX, 25 μM NBQX, and 50 μM CPP; p = 0.261, Mann-Whitney U-Test). Right, mIPSC amplitude (p = 0.386, Mann-Whitney U-Test). F) Left, sIPSC frequency (recorded at 0 mV in the presence of 25 μM NBQX and 50 μM CPP; p = 0.734, Mann-Whitney U-Test). Right, sIPSC amplitude (p = 0.409, Mann-Whitney U-Test). G–I) Deletion of Npas4 in SST neurons does not affect the layer distribution, soma size or dendritic complexity of SST neurons in the visual cortex. Density (G) and soma size (H) of tdTomato-labeled Npas4 WT (black) or cKO (red) SST neurons by cortical layer in P10-12 visual cortices (data represented as mean + SEM of 3 bioreps). I) Sholl analysis of dye-filled and reconstructed Npas4 WT (black) or cKO (red) SST neuron dendrites in the P11 visual cortex. Left: example images (scale bar = 50 μm), Right: quantification (p = 0.244, repeated measures ANOVA). (See also Figure S4)

