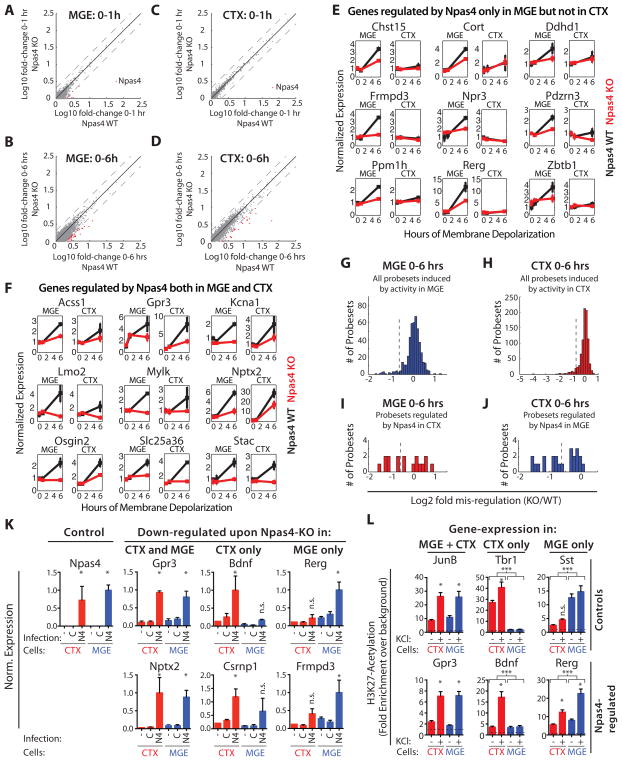
Figure 5. Npas4 regulates a cell type-specific activity-induced transcriptional program in inhibitory neurons.
A–D) Microarray analysis of the depolarization-induced gene expression response in Npas4 WT or KO MGE and CTX cultures. Scatter plots show the fold-change of every expressed probeset in WT cultures against its fold-change in KO cultures. Black line = unity, dotted lines = two-fold changes in either direction. Probesets misregulated by more than two-fold in the KO are labeled in red (the single strongly misregulated probeset in A and C represents Npas4) A) Early response (0–1h) in MGE cultures. B) Late response (0–6h) in MGE cultures. C) Early response (0–1h) in CTX cultures. D) Late response (0–6h) in CTX cultures. E–J) Analyis of microarray-experiments: Npas4 controls the activity-dependent induction of distinct sets of late-response genes in inhibitory and excitatory neurons. E, F) Microarray-based line plots of genes regulated by Npas4 specifically in MGE-neurons (E) or in both MGE- and CTX-neurons (F). Normalized expression is plotted versus duration of stimulus, data normalized to WT MGE 0h and presented as mean ± SEM of two bioreps (WT: black, KO: red). G, H) Histograms of all probesets induced in MGE (G) and CTX (H) cultures showing the misregulation in Npas4 KO cultures. Probesets to the left of the dotted lines are considered as Npas4-regulated I) Histogram showing the misregulation in Npas4 KO MGE cultures of all genes regulated by Npas4 in CTX cultures. Probesets to the right of the dotted line are considered as Npas4-regulated specifically in CTX-neurons. J) Histogram showing the misregulation in Npas4 KO CTX cultures of all genes regulated by Npas4 in MGE cultures. Probesets to the right of the dotted line are considered as Npas4-regulated specifically in MGE-neurons. K) Npas4-overexpression (OE) induces cell type-specific Npas4 target gene expression in the absence of neuronal activity. qPCR analysis of expression levels of cell type-specific and shared Npas4-targets after Npas4-OE in CTX (red) or MGE (blue). The cultures were either not infected (-) or infected at DIV4 with constructs expressing GFP (C) or Npas4 (N4), quieted O.N. at DIV7 and harvested on DIV8. (Data represent the mean + SEM of 4 Bioreps; * = significantly changed, p < 0.05, one-way ANOVA with Sidak’s multiple comparison correction,). L) Cell type-specific activation status of gene regulatory elements associated with Npas4-target genes reflects the cell type-specific regulation by Npas4. H3K27Ac ChIP on DNA isolated from CTX (red) and MGE cultures (blue) − KCl-depolarization. qPCR was done either on regulatory regions associated with control genes or on Npas4-binding regulatory regions associated with genes regulated by Npas4. Data are presented as fold enrichment above background (dashed black line; n=4 for CTX, n=5 for MGE; * = significant change of H3K27Ac-levels within a cell type ; *** = significant difference of H3K27Ac across CTX and MGE. * and *** p < 0.05, one-way ANOVA with Sidak’s multiple comparison correction). (See also Figure S5)

