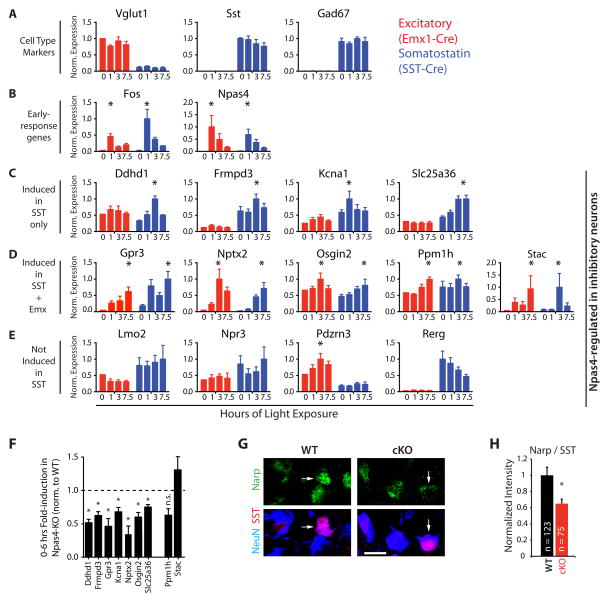
Figure 6. Npas4 regulates a cell type-specific set of target genes induced by sensory stimulation in SST neurons in vivo.
A–E) Npas4 target genes identified in inhibitory neurons in vitro are induced by sensory experience in a cell type-specific manner in vivo. Normalized expression of ribosome-associated mRNA from the visual cortex of Emx1-Cre (red) or SST-Cre (blue) expressing neurons in dark-housed mice (0 hrs) and after light exposure (1, 3, 7.5 hrs) (Data represent mean + SEM of 3 bioreps, * = induction defined as a mean >30% increase from the 0h time point). A) Cell type-specific marker genes. B) Early-response genes. C) Npas4-target genes induced selectively in SST neurons D) Npas4-target genes induced in both excitatory and SST neurons. E) Npas4-target genes that are not induced in SST neurons. F-H) Experience-induced Npas4 targets in SST neurons are misregulated in the absence of Npas4 in the visual cortex in vivo. F) Reduced induction of Npas4-targets in the visual cortex of Npas4-KO mice in response to sensory stimulation. KO and WT mice were dark-housed and light-exposed and qPCR analysis was performed on RNA isolated from the visual cortex. (Data represented as mean + SEM of the stimulus-induced fold-change in KO mice relative to the normalized fold-change observed in WT mice. n = 3 animals per genotype and time-point, * = significantly changed induction, p < 0.05, two-tailed t-test). G–H) The levels of Narp, the protein product of the Npas4 target gene Nptx2, are reduced in SST neurons lacking Npas4. G) Coronal sections from the visual cortex of P11 Npas4 WT and cKO mice lacking Npas4 specifically in SST neurons stained with antibodies directed against Narp (green) and the pan-neuronal marker NeuN (blue) (Scale bar = 10 μm). (H) Quantification of the intensity of Narp immunostaining in SST neuron somata (arrows) in (G). (Data represented as mean + SEM of normalized intensity value across all SST neurons imaged. * = significant difference, p < 0.005, Mann-Whitney U-Test). (See also Figure S6)

