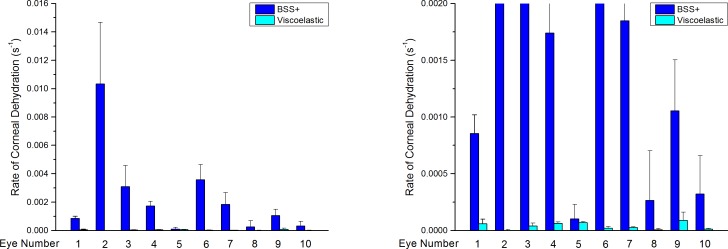
Figure 5.
Rate of tear film evaporation for all 10 eyes is shown in dark blue for BSS+ and in cyan for viscoelastic (left) applications. The graph (right) shows the same data but with the y-axis adjusted so that the rate of tear film evaporation with viscoelastic can be put into perspective at the cost of clipping some of the BSS data (right).

