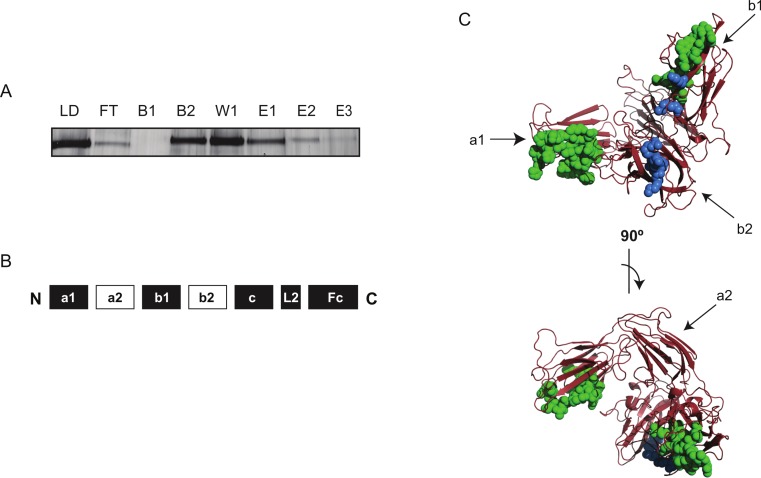
Figure 3. Identification of the protected regions of Fc rNRP-1 upon interaction with heparin.
(A) Represents the steps of analysis of Fc rNRP-1. Lane (LD) corresponds to the sample applied to the heparin column, lane (FT) is the flow through or unbound material after applying the sample three times to the column, lanes (B1 and B2) are the flow through from the two acetylation steps, lane (W1) is the post acetylation wash of the column, elution (E1) is the material eluted from the column with 2 M NaCl, lane (E2) is the same material after biotinylation (E2), and (E3) is the biotinylated material after concentration and buffer exchange. Five% (v/v) of the total material (4 µg) was analysed on SDS-PAGE and silver stained. (B) Schematic structure of Fc rNRP-1, where peptides with biotinylated lysines were identified are labelled as black squares. (C) Two perspectives of the NRP-1 structure based on in silico modelling (a1–b2 domains) with highlighted residues corresponding to the assigned peptides according to the sequence alignment. In green labelled regions identified by the Protect and Label strategy, in blue the residues identified as heparin-interacting according to Vander Kooi et al. (2007). See Fig. S3 for the alignment of NRP-1 sequences corresponding to this structure, with annotated identified peptides.

