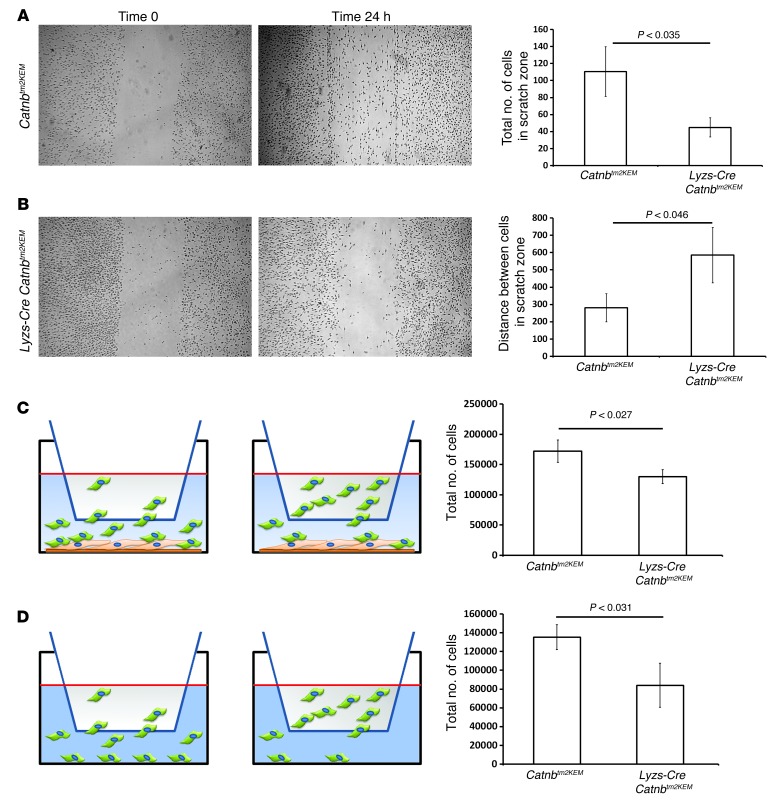
Figure 6. β-Catenin regulates macrophage migration.
Representative photomicrographs of a scratch assay performed with (A) Lyzs-Cre ROSA-EYFP macrophages and (B) macrophages from Lyzs-Cre Catnbtm2KEM ROSA-EYFP mice showing cell migration immediately after scratching and after 24 hours. Migration was quantified by counting the number of cells migrating into the scratch and by measuring the gap. Bar graphs show the means and 95% CI for the number of cells in the scratch zone and the average distance between the 2 edges of the scratch after 24 hours. (C) Boyden migration assay with macrophages seeded in the upper chamber and fibroblasts in the lower chamber. The total number of cells in the lower chamber was significantly lower when macrophages from Lyzs-Cre Catnbtm2KEM ROSA-EYFP mice were used compared with the total number in control macrophages. (D) Boyden migration assay using macrophages in the upper chamber, with no cells in the lower chamber. The number of migrated cells in the lower chamber was significantly smaller when macrophages from Lyzs-Cre Catnbtm2KEM ROSA-EYFP mice were used compared with the number observed in control macrophages. Graphs show the mean ± 95% CI of data from macrophages from 4 mice in each group.

