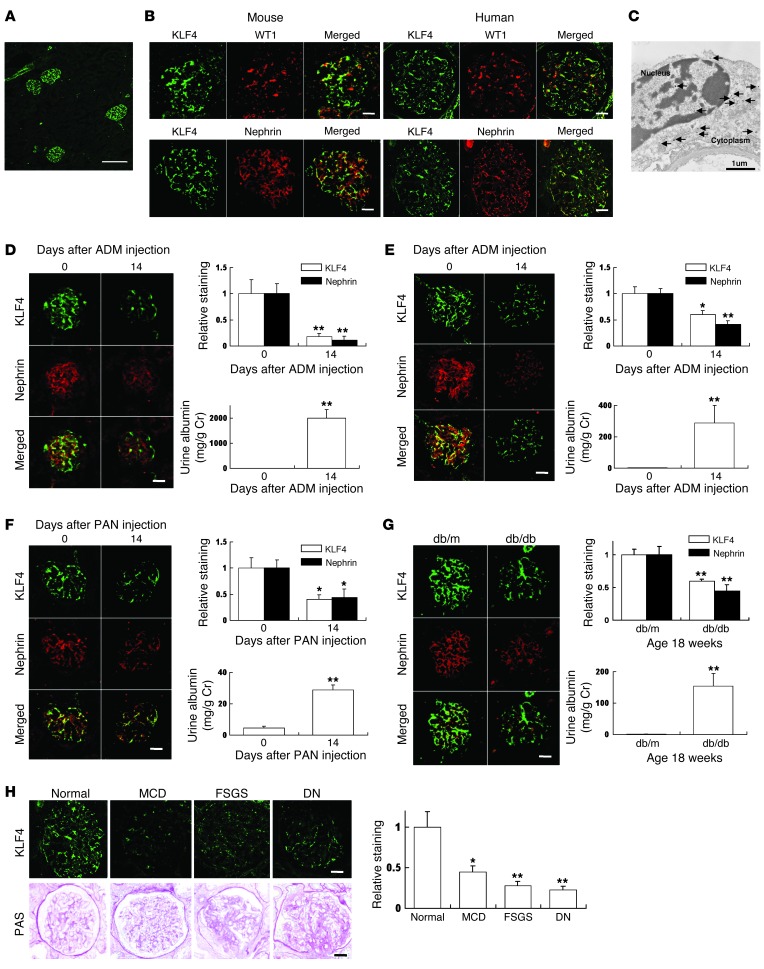
Figure 1. KLF4 is expressed in glomerular podocytes, and its expression is decreased in proteinuric glomerular disease models.
(A) Representative low-power photomicrographs of immunofluorescence staining of KLF4 in kidneys of 8-week-old male C57BL/6J mice. (B) Representative photomicrographs of immunofluorescence double staining of KLF4 (green)/WT1 or nephrin (red) in normal kidney of 8-week-old male C57BL/6J mice or normal human kidney. (C) Immunoelectron microscopy staining of KLF4 in the nucleus and cytoplasm of podocytes in the mouse kidney. Arrows indicate gold particles detecting KLF4 expression. (D–G) KLF4 expression in the ADM nephropathy model in (D) BALB/c mice and (E) C57BL/6J mice, (F) the PAN nephropathy model, and (G) the DN model (n = 5–6 per time point). (Left panels) Representative photomicrographs of immunofluorescence double staining of KLF4 (green)/nephrin (red). (Right panels) Quantification of the immunolabeled area and albuminuria. For the ADM or puromycin nephropathy model, mice were injected with ADM or puromycin at the doses described in Supplemental Methods and sacrificed at the indicated times after injection. For the diabetic model, diabetic (db/db) mice and controls (db/m) were compared at age 18 weeks. (H) (Left panel) Representative immunofluorescence photomicrographs of KLF4 in kidney biopsies from patients with proteinuric glomerular diseases. The bottom row shows the glomerular histology stained with PAS. (Right panel) Relative staining of KLF4 in the biopsy samples compared with control values. Clinical data are presented in Supplemental Table 1. *P < 0.05; **P < 0.01 vs. controls. Scale bars: 100 μm. (A); 25 μm (mouse), 50 μm (human) (B); 25 μm (D–G); 50 μm (H).

