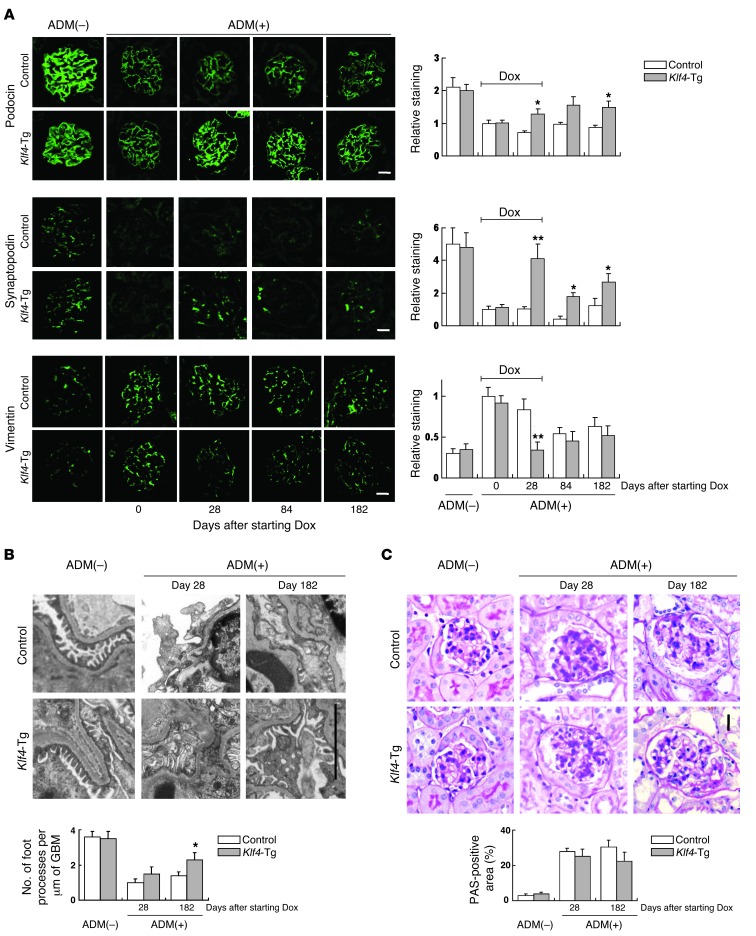
Figure 3. Restoration of podocyte KLF4 expression in diseased glomeruli alters phenotype marker expression.
Details of the experimental protocol are provided in the Figure 2 legend. (A) (Left panel) Representative confocal photomicrographs and (right panel) quantification of podocin, synaptopodin, and vimentin expression at the indicated days after starting Dox in Dox-inducible podocyte-specific Klf4 transgenic mice (podocin-rtTA TetO Klf4) and controls (Pod/–). Scale bars: 25 μm. (B) (Top panel) Representative electron photomicrographs and (bottom panel) quantification of podocyte foot process effacement at the indicated days after starting Dox. Scale bar: 5 μm. (C) Representative photomicrographs of renal histology (PAS staining) without ADM treatment or at the indicated days after starting Dox in ADM nephropathy. Control: results for control mice (Pod/–); Klf4-Tg: results for podocyte-specific Klf4 transgenic mice (podocin-rtTA TetO Klf4). Scale bar: 25 μm. *P < 0.05; **P < 0.01 vs. Pod/– controls.

