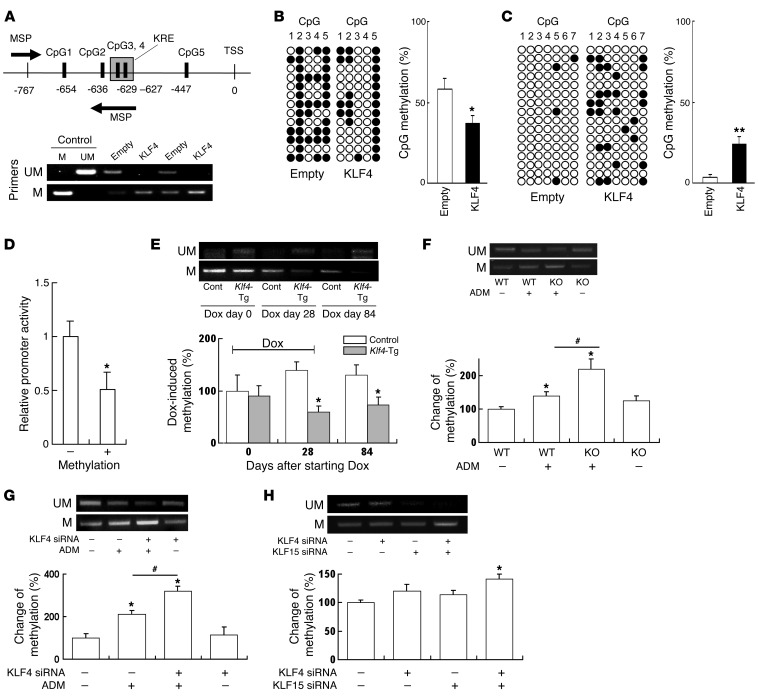
Figure 7. KLF4 expression causes demethylation of the nephrin promoter and methylation of the vimentin promoter in podocytes.
(A) (Upper panel) Map of nephrin promoter MSP primers and 5 CpG sites analyzed by BGS. (Lower panel) Results of MSP using primers for unmethylated (UM, top) and methylated (M, bottom) nephrin promoter. (B and C) Results of BGS of (B) nephrin and (C) vimentin promoter in KLF4-overexpressing podocytes and controls. The columns correspond to the CpG sequences shown in Supplemental Figure 8. Each row represents a single sequenced clone. White dots, unmethylated CpGs; black dots, methylated CpGs. The bar graph shows the net methylation of the analyzed CpG sites. KLF4, KLF4-overexpressing podocytes, empty: empty vector–transfected control podocytes. (D) Relative promoter activity of pCpG-free promoter plasmid containing nephrin promoter before (–) or after (+) methylation with SssI (n = 6). (E–H) (Upper panels) Results of MSP using primers for unmethylated (UM, top) and methylated (M, bottom) nephrin promoter. (Lower panels) Changes of methylation (%) using real-time MSP analysis in (E) laser-microdissected glomeruli of Klf4-transgenic mice or controls at the indicated times after starting of Dox in the protocol used for Figure 2A (n = 4), (F) laser-microdissected glomeruli of Klf4 KO mice or controls with or without ADM in the protocol used for Figure 4A (n = 4), (G) podocytes treated with KLF4 siRNA or control RNA with or without ADM in the protocol of Figure 6 (n = 6), and (H) podocytes with KLF4 and/or KLF15 siRNA for 48 hours (n = 6). *P < 0.05, **P < 0.01 vs. controls; #P < 0.05 versus the respective groups.

