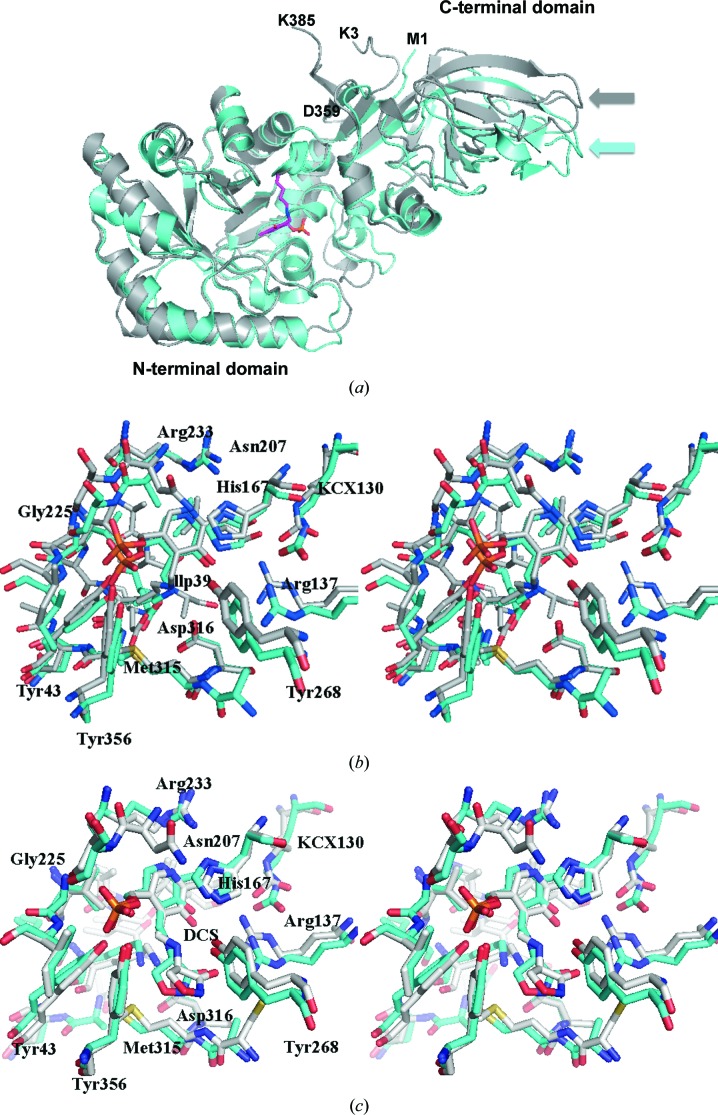
Figure 7.
Comparison of C. difficile and E. coli Alr. (a) Superposed ribbon diagram of CdAlrK271T (gray) with EcAlr (cyan). The larger hinge angle of EcAlr is obvious from the displacement of the corresponding loops in the C-terminal domain, indicated by arrows. The N-terminal residue (Lys3) and C-terminal (Lys385) residue of the CdAlrK271T structure are labeled. Also labeled are the N-terminal (Met1) and C-terminal (Asp359) residues of the EcAlr structure. (b) A stereoview of the superposed active sites of CdAlrK271T (gray) and EcAlr (green). (c) A stereoview of the superposed residues in the active site of CdAlrcycloserine (gray) and EcAlr in complex with cycloserine (green).

