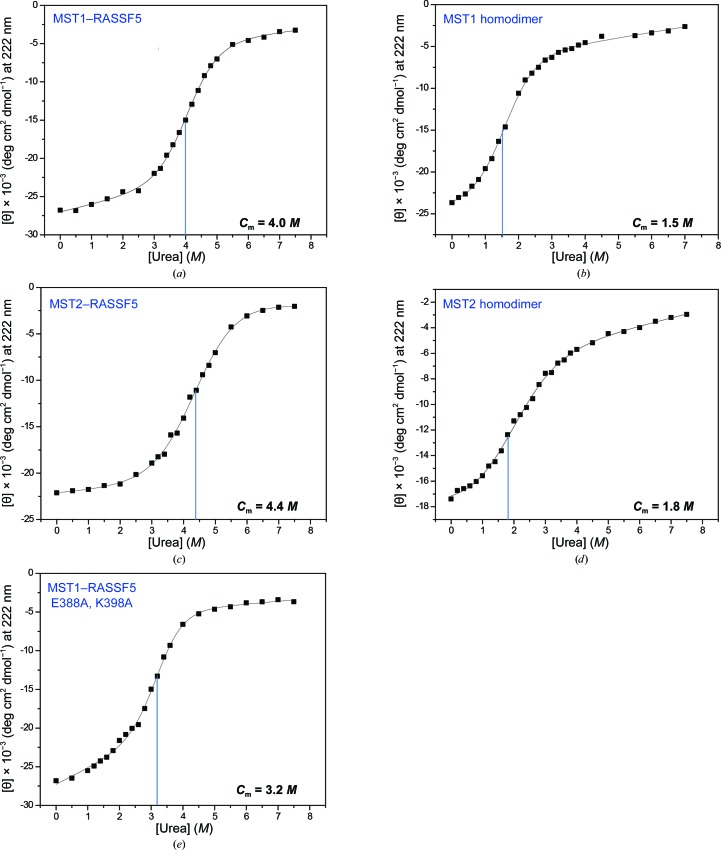
Figure 4.
Comparison of the urea-induced denaturation curves of SARAH domains. The secondary-structural changes in the SARAH domains upon increases in the urea concentration were observed by monitoring the molar ellipticity [θ] at 222 nm in far-UV circular dichroism (CD) for the MST1–RASSF5 SARAH heterodimer (a), the MST1 SARAH homodimer (b), the MST2–RASSF5 SARAH heterodimer (c), the MST2 SARAH homodimer (d) and a double-mutant MST1–RASSF5 (E388A and K398A of RASSF5) SARAH heterodimer (e). Dotted lines indicate the transition concentration (C m) of urea for the denaturation of α-helical structures.

