Figure 1.
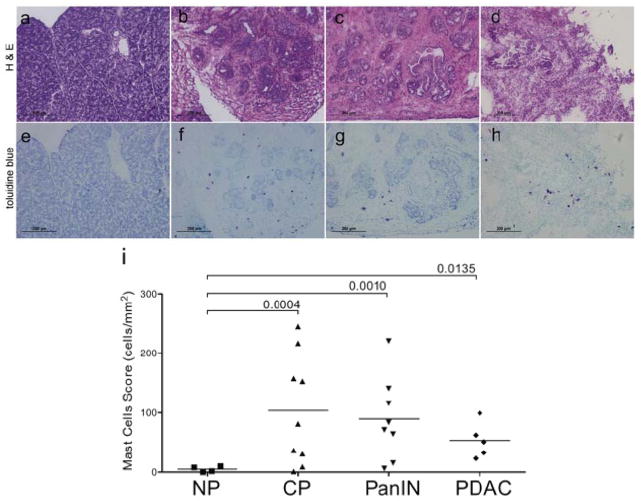
Mast cell infiltration during PDAC development in K-rasG12V mice. (a and e) Few mast cells were found in NP tissue (200x). (b and f) Influx of mast cells in CP (200x). (c and g) Influx of mast cells in PanIN (200x). (d and h) Influx of mast cells in PDAC (200x). (a-d) Hematoxylin and eosin staining. (e-h) Toluidine blue staining. Serial sections were stained with hematoxylin and eosin and toluidine blue; mast cells were stained red-purple (metachromatic staining against a blue background). (i) Quantitative evaluation of mast cell infiltration in pancreatic tissues (score = the ratio of the total number of mast cells to the area of pancreas) during PDAC development. The P values for the comparison between CP, PanIN, and PDAC vs. NP are as indicated. The P values for the comparison of PDAC vs. CP and PDAC vs. PanIN were all > 0.5, showing no statistical difference.

