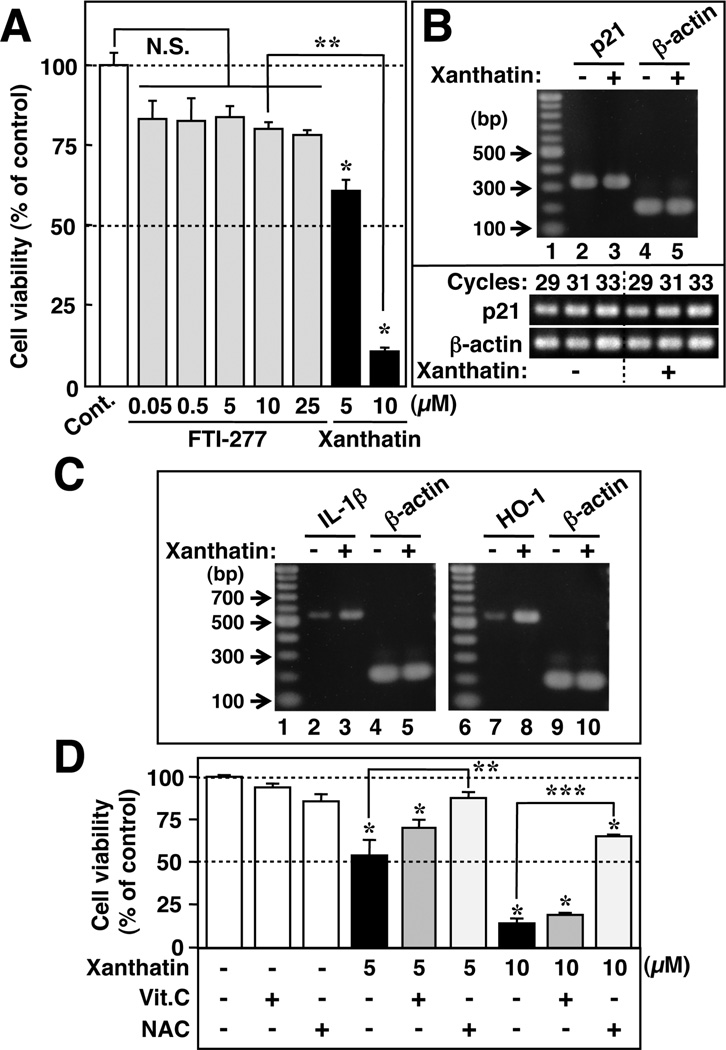
Figure 3.
(−)-Xanthatin-mediated growth suppression of MDA-MB-231 cells is accompanied by elevations in stress-responsive gene expression but not p21. (A) MDA-MB-231 cells were exposed for 48 h to increasing concentrations of FTI-277 (0.05−25 µM) and (−)-xanthatin (5 and 10 µM). Data are expressed as the percent of vehicle-treated group (control), as mean ± SD (n = 5). *Significantly different (p < 0.05) from the control. **Significantly different (p < 0.05) from the 10 µM FTI-277-treated group. N.S., not significant. (B) RT-PCR analysis of p21 mRNA levels after treatment with (−)-xanthatin at 10 µM. β-Actin was used as an RNA normalization control. Lane 1, 100-bp DNA ladder marker; lanes 2 and 4, mRNA levels in the absence of (−)-xanthatin; and lanes 3 and 5, mRNA levels in the presence of (−)-xanthatin. p21 mRNA level was not influenced by (−)-xanthatin (see inset; see also Figure 4A–a). A representative data image is shown. (C) RT-PCR analysis of IL-1β and HO-1 mRNAlevels after treatment with 10 µM (−)-xanthatin. β-Actin was used as an RNA normalization control. Lanes 1 and 6,100-bp DNA ladder marker; lanes 2,4, 7, and 9, mRNAlevels in the absence of (−)-xanthatin; and lanes 3, 5, 8, and 10, mRNAlevels in the presence of (−)-xanthatin up-regulated transcript levels for the stress responsive genes, IL-1β and HO-1. A representative data image is shown. (D) MDA-MB-231 cells were treated for 48 h with 5 µM or 10 µM(−)-xanthatin in the presence (+) or absence (−) of two antioxidants, vitamin C (Vit.C) and N-acetyl-L-cysteine (NAC), respectively. Each inhibitor was added (Vit.C, 25 µM; NAC, 1 mM, respectively) as a pretreatment, 2 h in advance to (−)-xanthatin additions. Data are expressed as the percent of vehicle-treated group (−/−/− group), as the mean ± SD (n = 5). *Significantly different (p < 0.05) from the control. **Significantly different (p < 0.05) from the 5 µM (−)-xanthatin alone-treated group. ***Significantly different (p < 0.05) from the 10 µM (−)-xanthatin alone-treated group.

