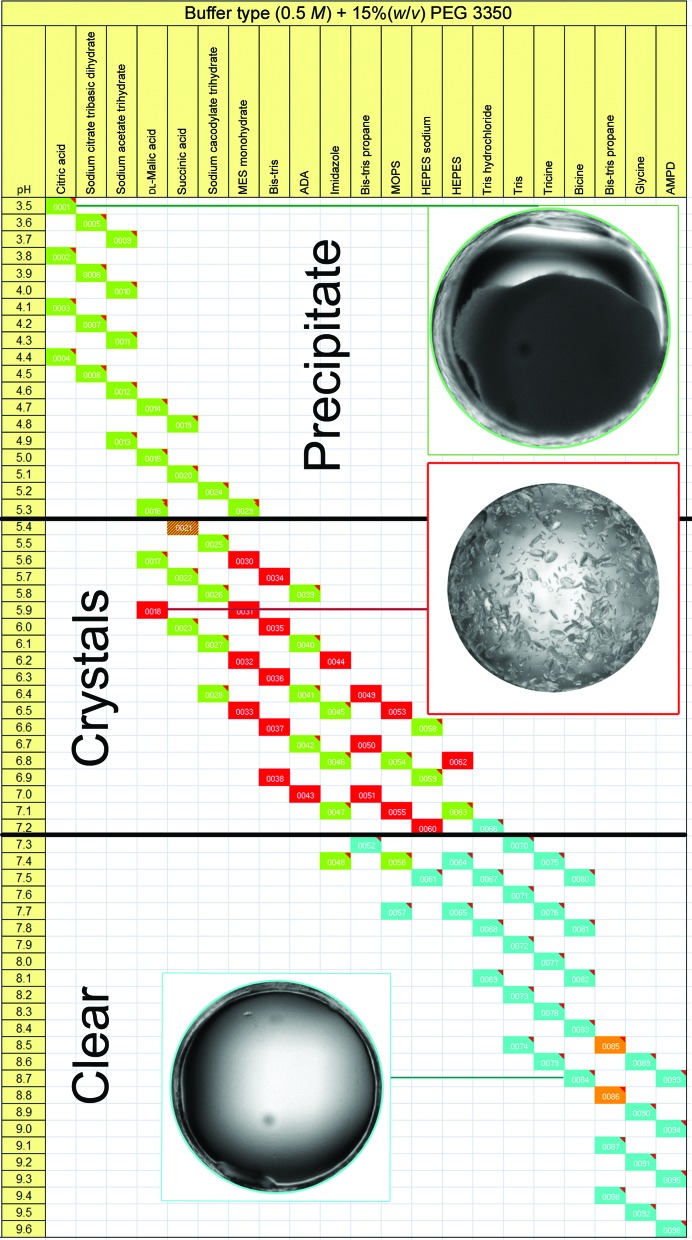
Figure 4.
Chemical space layout of a pH/buffer-type screen. This clearly illustrates cases where having an identical chemical buffer at different pH and vice versa can alter the outcome of an experiment. Analysis of a putative glutathione-dependent formaldehyde-activating enzyme, pI = 6.88, with the Hampton Research Slice pH screen modified for microbatch with the addition of 15%(w/v) PEG 3350 and buffer concentrations of 0.5 M. Acidic pH produced heavy precipitate (green) in the range 3.5 ≤ pH ≤ 5.3. In the pH range 5.4 ≤ pH ≤ 7.2 crystals (red) or precipitates (green) formed depending on the pH and the chemistry. Mainly clear drops (blue) were formed in the range 7.3 ≤ pH ≤ 9.6. This screen very effectively distinguishes buffer pH from buffer-type effects on crystallization. The diameter of the circle is 0.9 mm.

