Figure 6.

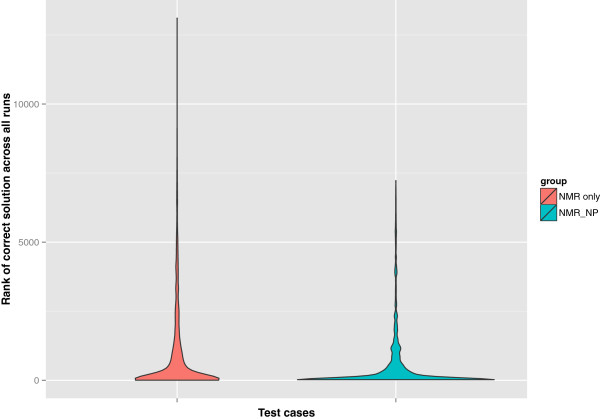
Distribution of ranks of all the correct solutions across all test cases and runs. The overall distribution of ranks given to the correct structure as shown in Figure 5, is summarised here using a violin plot.

Distribution of ranks of all the correct solutions across all test cases and runs. The overall distribution of ranks given to the correct structure as shown in Figure 5, is summarised here using a violin plot.