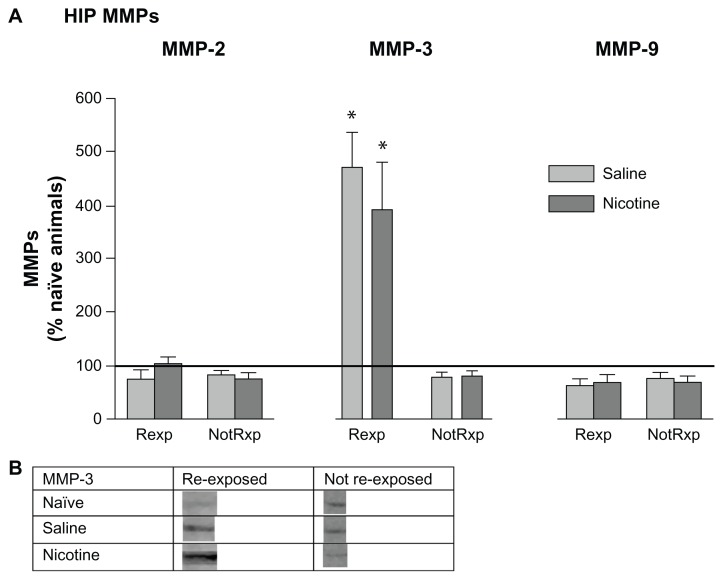
Figure 7.
Mean (±SEM) changes in HIP MMP levels following re-exposure to the CPP chamber after 5 days of rest. (A) Data were normalized to naïve home cage control protein levels (horizontal line). Rexp = re-exposed to the CPP chamber. NotRxp = not re-exposed to the CPP chamber. Naïve home cage control group: n = 4; aCSF-PBS group: n = 7; aCSF-Nic group: n = 7. *P < 0.01. (B) Protein densities of representative bands from Western blots of HIP tissues.

