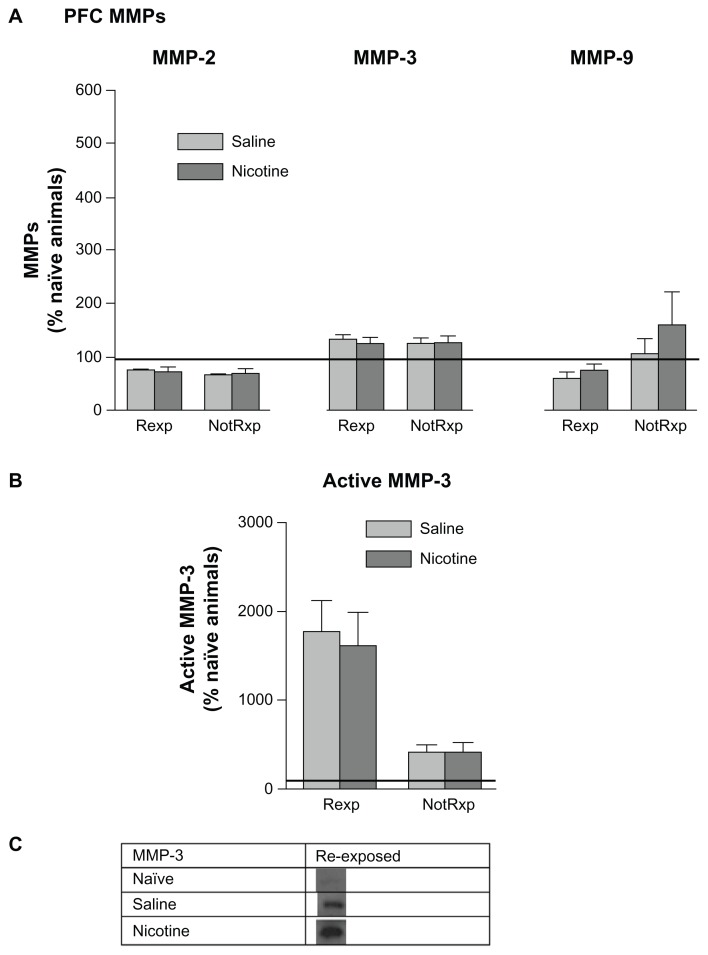
Figure 8.
Mean (±SEM) changes in PFC MMP levels following re-exposure to the CPP chamber on day 12 following 5 days of rest. Refer to Figure 7 for an explanation of terminology. (A) There were no significant differences among the levels of pro-MMPs among groups. (B) An elevation in the 45 kDa active MMP-3 form was measured in the re-exposed group. *P < 0.01. (C) Representative protein bands from Western blots of 45 kDa active MMP-3 measured in PFC tissues.

