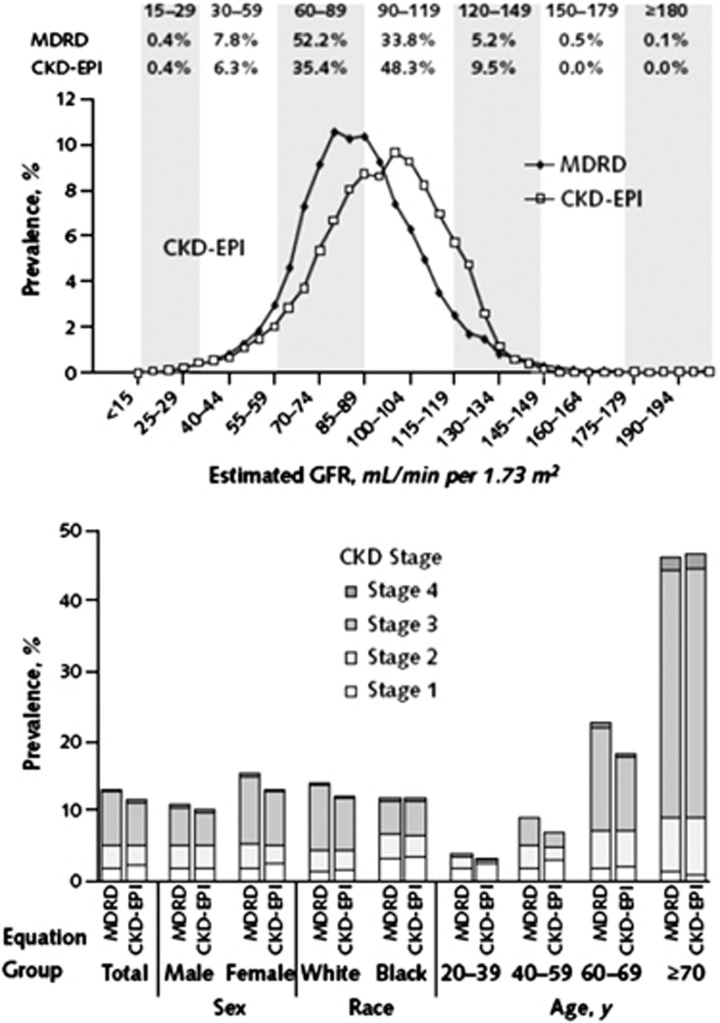
Figure 12.
Comparison of distribution of GFR and CKD prevalence by age (NHANES 1999-2004). GFR was categorized on the basis of the classification system established by the NKF-KDOQI. Top. Distribution of estimated GFR, by 4-ml/min per 1.73 m2 categories. Values are plotted at the midpoint. Bottom. Prevalence of CKD, by age. CKD, chronic kidney disease; GFR, glomerular filtration rate; NKF-KDOQI, National Kidney Foundation-Kidney Disease Outcomes Quality Initiative; NHANES, National Health and Nutrition Examination Survey. Reprinted with permission from Levey AS, Stevens LA, Schmid CH, et al.87 A new equation to estimate glomerular filtration rate. Ann Intern Med 2009; 150(9): 604-612.

