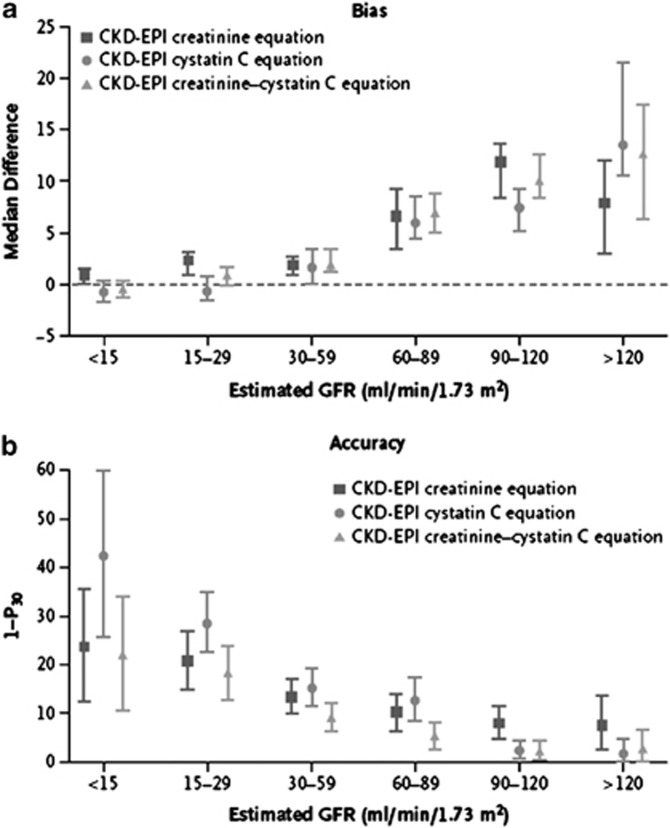
Figure 15.
Performance of three equations for estimating GFR. Panel a shows the median difference between measured and estimated GFR. The bias is similar with the equation using creatinine alone, the equation using cystatin C alone, and the combined creatinine–cystatin C equation. Panel b shows the accuracy of the three equations with respect to the percentage of estimates that were greater than 30% of the measured GFR (1 – P30). Whiskers indicate 95% confidence intervals. GFR, glomerular filtration rate; P30, percentage of estimated GFR values within 30% of measured GFR. From N Engl J Med, Inker LA, Schmid CH, Tighiouart H, et al.113 Estimating glomerular filtration rate from serum creatinine and cystatin C. 367: 20-29. Copyright © 2012 Massachusetts Medical Society. Reprinted with permission from Massachusetts Medical Society.

