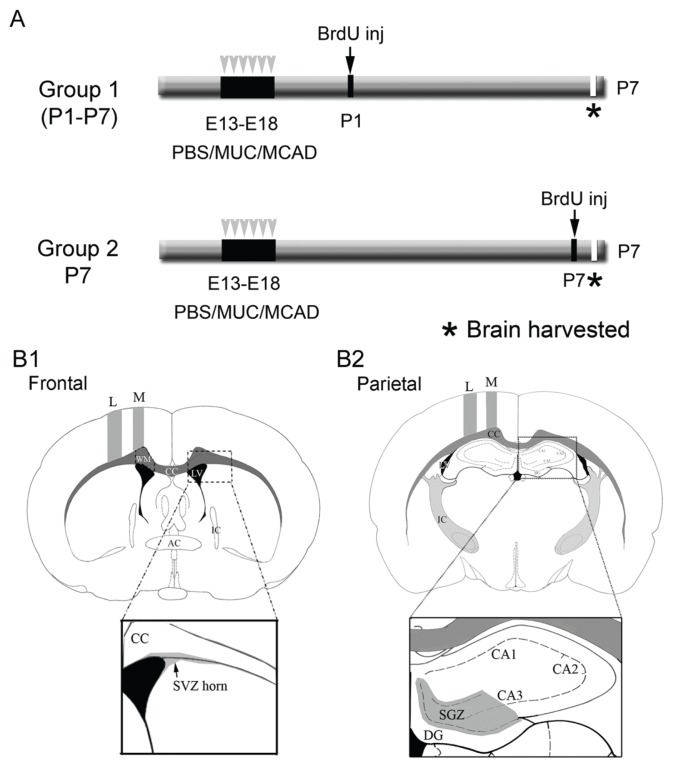
Figure 1.
A. Schematics of experimental protocol. Group 1 represents the cell maturation and cell survival cohort and group 2, the proliferation profile for postnatal neurogenesis. B. Representation of ROIs investigated to examine stem-cell niche proliferation and BrdU-positive cell distributions in neocortex and hippocampus. The sections represent mouse brain atlas coordinates: A. Frontal ~bregma 0.70–0.90 mm and B. Parietal ~bregma −1.70–1.90 mm.12 Section A represents the frontal coordinate for SVZ anterior horn analysis and section B represents the parietal coordinate for SGZ analysis (see magnified views).
Abbreviations: L, lateral; M, medial; WM, white matter; CC, corpus callosum; LV, lateral ventricle; IC, internal capsule; DG, dentate gyrus; CA, Ammon’s horn of hippocampus and respective subfields.

