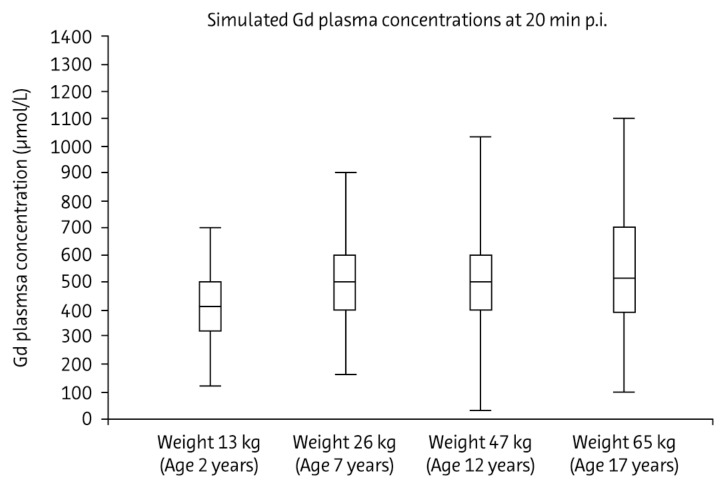
Figure 4.
Simulated gadolinium concentrations in plasma 20 minutes after injection of 0.1 mmol/kg body weight gadobutrol in four subjects of different ages represented by typical body weight. Boxes represent interquartile range, with the center horizontal line at median. Whiskers extend to data nearest to a distance of at most 1.5 times the interquartile range. Reproduced from Gabriele Hahn, Ina Sorge, Bernd Gruhn, Katja Glutig, Wolfgang Hirsch, Ravi Bhargava, Julia Furtner, Mark Born, Cronelia Schroder, Hakan Ahlstrom, Sylvie Kaiser, Jorg Detlev Moritz, Christian Wilhelm Kunze, Manohar Shroff, Eira Stokland, Zuzana Jirakova Trnkova, Marcus Schultze-Mosgau, Stefanie Reif, Claudia Bacher-Stier, Hans-Joachim Mentzel, Pharmacokinetics and Safety of Gadobutrol-Enhanced Magnetic Resonance Imaging in Pediatric Patients, Invest Radiol, 2009;44:776–783 with permission from Wolters Kluwer Health.

