
Figure 3.
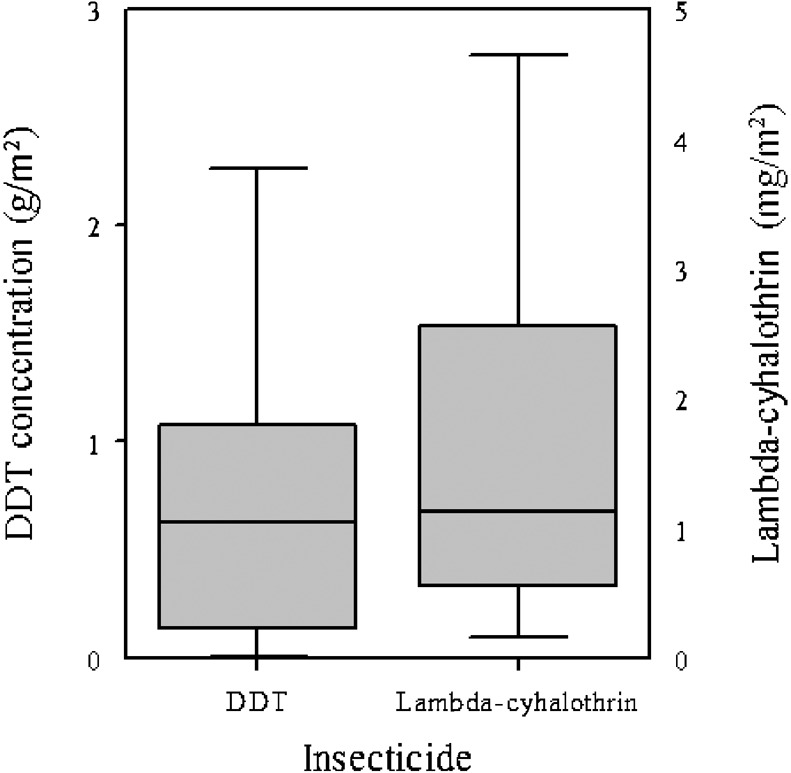
Box plots showing the DDT and lambda-cyhalothrin concentrations on filter-paper samples that had been sprayed by spray teams involved in indoor residual spraying against Phlebotomus argentipes. The results in each plot come from 40 filter-paper samples (from six houses in four villages). The concentrations were approximately normally distributed, with P-values of 0.52 for DDT and 0.98 for lambda-cyhalothrin.