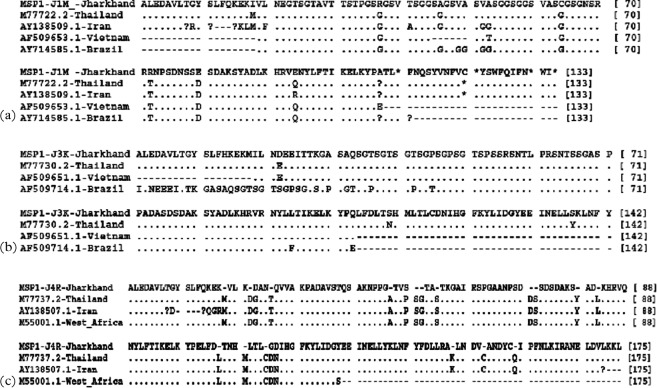
Fig. 3.
Alignment for the amino acid sequences corresponding to (a) MAD20, (b) K1 and (c) RO33 families of msp-1. Sequences shown are collected during the study and as compared to the sequences from the GenBank database. Gaps are represented by minus sign (−), missing amino acids are represented by question mark sign (?) and alphabets represent a change in amino acid at the position.

