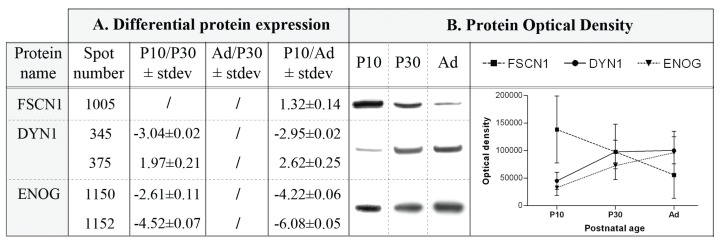
Figure 3.
Western analysis as validation of 2-D DIGE results. A) Overview of 2-D DIGE ratios for 3 differentially expressed proteins FSCN1, DYN1, and ENOG over the course of postnatal forebrain development. B) For FSCN1, a single 55 kDa protein band was detected, for DYN1 a 100 kDa band, and for ENOG a 48 kDa band. The optical densities are plotted against postnatal age. In accordance with 2-D DIGE results, FSCN1 expression diminished with age, while DYN1 and ENOG expression gradually increased.

