Figure 2.

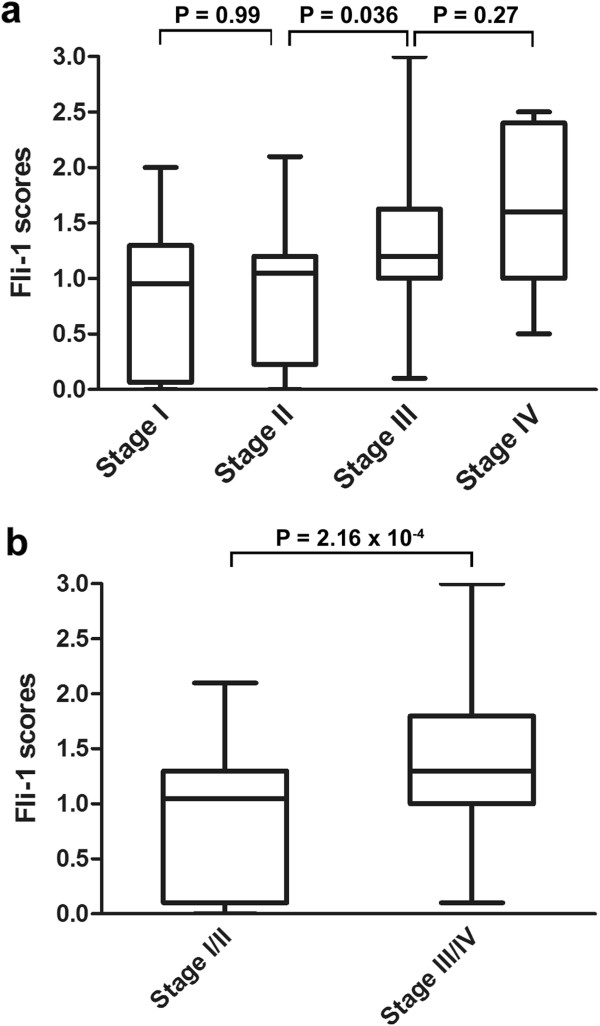
Inverse correlation between Fli-1 expression and tumor stage. (a) Box plot of Fli-1 expression in tumors with different stage. (b) Box plot of Fli-1 expression in low stage and advanced stage.

Inverse correlation between Fli-1 expression and tumor stage. (a) Box plot of Fli-1 expression in tumors with different stage. (b) Box plot of Fli-1 expression in low stage and advanced stage.