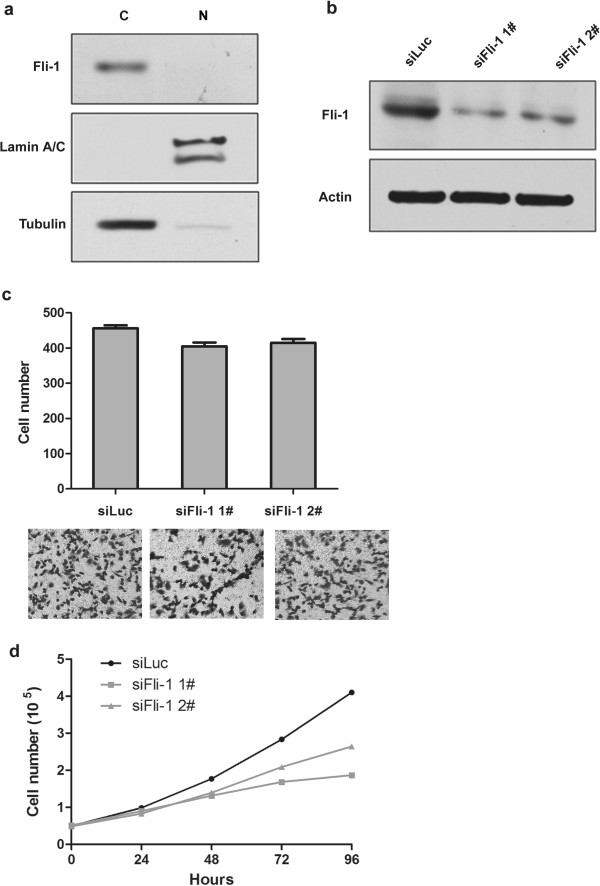
Figure 4.

Present of Fli-1 and growth characteristics of SKOV3 cells with Fli-1 expression down-regulated. (a) Western blots showing the purity of the isolated nucleus/cytoplasm sample, nuclear (N) and cytoplasmic (C). (b) SiRNA transfection efficiency in tumor cells was measured by Western blotting; (c) Transwell migration assay of the indicated cell lines transfected with Fli-1 constructs or transient transfected with two different Fli-1 siRNA target sequence. (d) The growth curve displays the absolute counts of cells cultured in twelve-well plates during the 4-day treatment.
