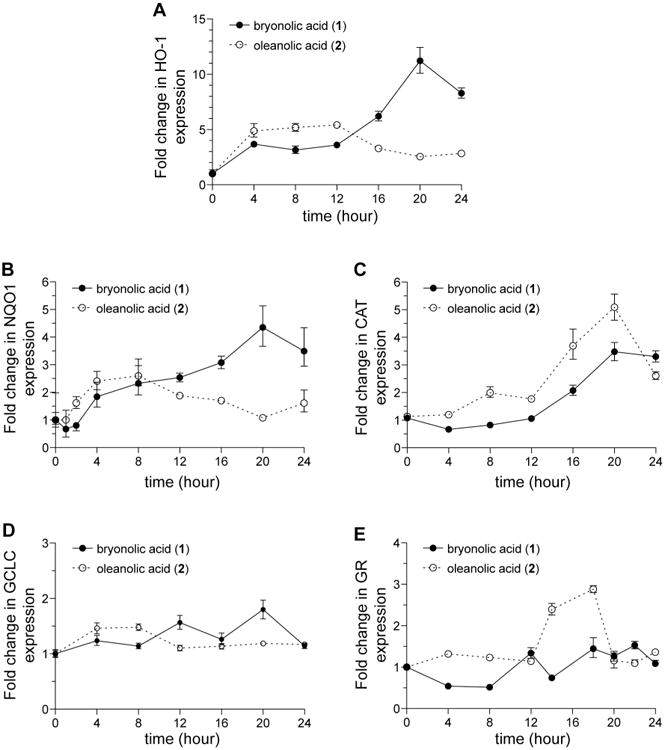
Figure 5.

Bryonolic acid (BA) (1) differentially induces Nrf2 target genes compared with oleanolic acid (2). RAW 264.7 cells were treated with 100 μM BA (1) or OA (2) at different time points. qRT-PCR was performed to measure HO-1 (A), NQO1 (B), CAT (C), GCLC (D), and GR (E) expression at various time points.
