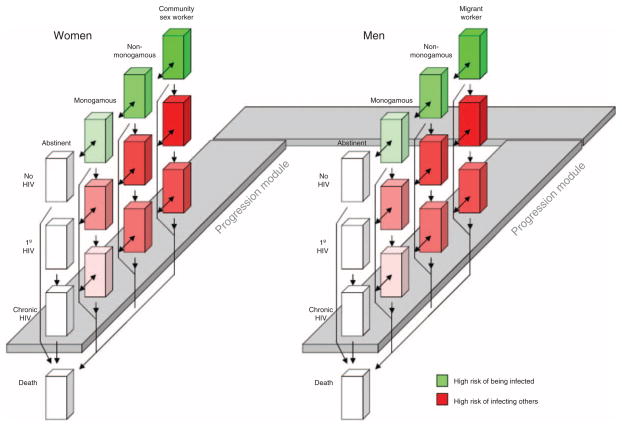
Fig. 1. Schematic of computer simulation.
The progression module provides data to inform the transmission module. Additionally, there are important simulation features that are not depicted in the diagram. The probability of transmission is higher from men to women, and lower from women to men. Additionally, mixing may be asymmetric by age (greater from older men to younger women; lower from younger men to older women). Although similarly sized cubes are used to designate different states of the simulation, this is not meant to suggest that the number of individuals in each state is similar: the proportion may vary from state to state, and may also vary between corresponding states of men and women. 1° HIV, primary HIV infection.

