
Fig. 9.
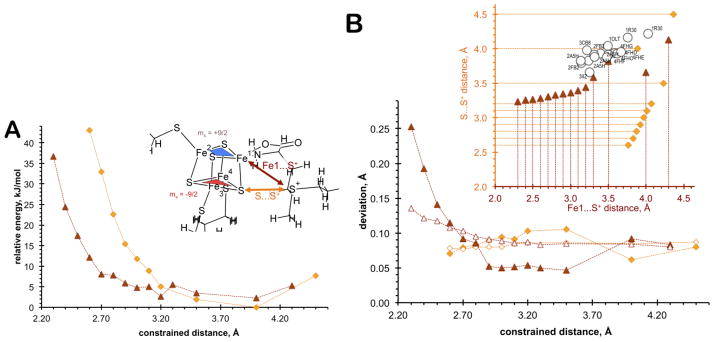
(A) Potential energy curves for the scanned Fe1…S+ (brown triangles) and S…S+ (orange diamonds) distances. Inset: Illustration of the scanned distances and the antiferromagnetically coupled [2Fe-2S] rhombs. (B) Deviation between Fe…Fe distances within ferromagnetically coupled [2Fe-2S] rhombs shown with blue and red shapes in inset of (A) (solid symbols) and between antiferromagnetically coupled [2Fe-2S] rhombs (hollow symbols) as a function of scanned Fe1…S+ (brown triangles) and S…S+ (orange diamonds) distances. Inset: Calculated and experimental correlation between Fe1…S+ and S…S+ distances as metric parameters for SAM and [4Fe-4S] interaction (orange diamonds and brown triangles represent optimized Fe1…S+ and S…S+ distances when S…S+ and Fe1…S+ distances were kept fixed, respectively; hollow circles represent experimental data with PDB codes (1OLT [3]; 1R30 [9]; 2ASH [14]; 2FB2 [4, 5]; 3CB8 [2]; 3IIZ [1])