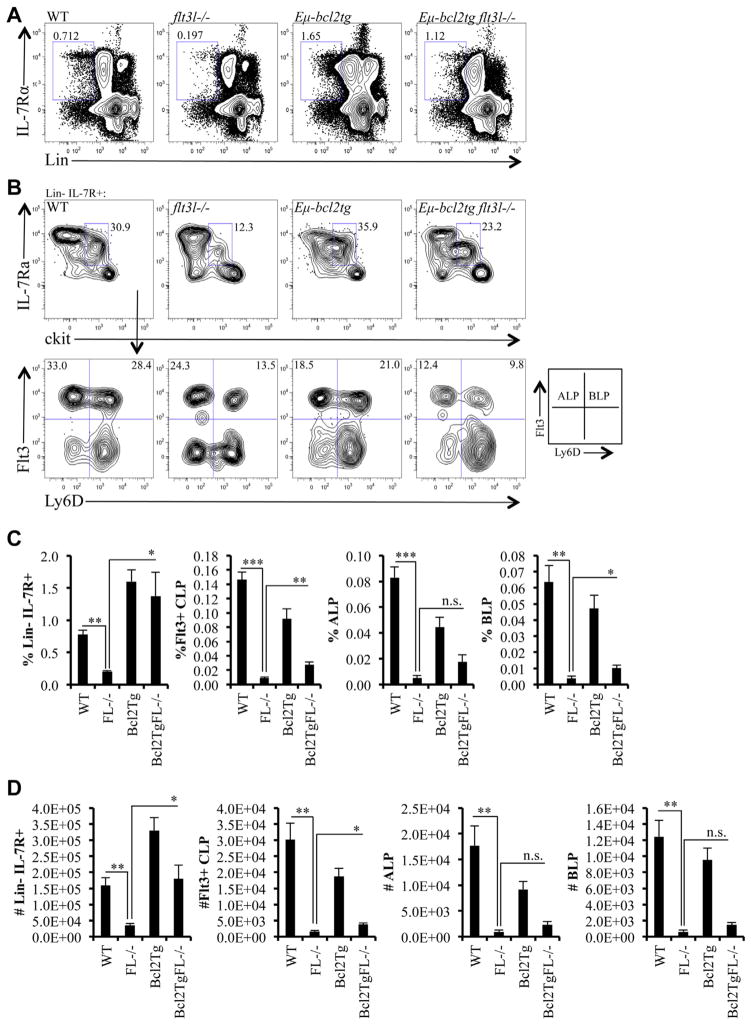
Figure 2.
Enforced expression of Bcl2 rescues CLPs, but not the deficiency in Flt3+ CLPs in flt3l−/− mice. (A) Flow cytometric analysis of Lin−IL-7Rα+ from a representative WT, flt3l−/−, Eμ-bcl2tg, and Eμ-bcl2tg flt3l−/− mouse. (B) c-kitlo IL-7Rα+ CLP compartment (pregated on Lin−IL-7Rα+, top panels) across the four genotypes further stained with Ly6D and Flt3 to examine Ly6D− ALPs and Ly6D+ BLPs (bottom panels). (C, D) Bar graphs illustrating the frequency (C) and numbers (D) of Lin−IL-7Rα+, Flt3+CLPs, ALPs, and BLPs across the four genotypes. Data are representative of four to seven mice per genotype and four to five independent experiments. Error bars represent mean ± SEM. *p ≤ 0.05, **p ≤ 0.005, ***p < 0.0001, Student’s t-test at, between the means of different genotypes. n.s. = nonsignificant differences between genotypes measured using Student t test at p > 0.05.

