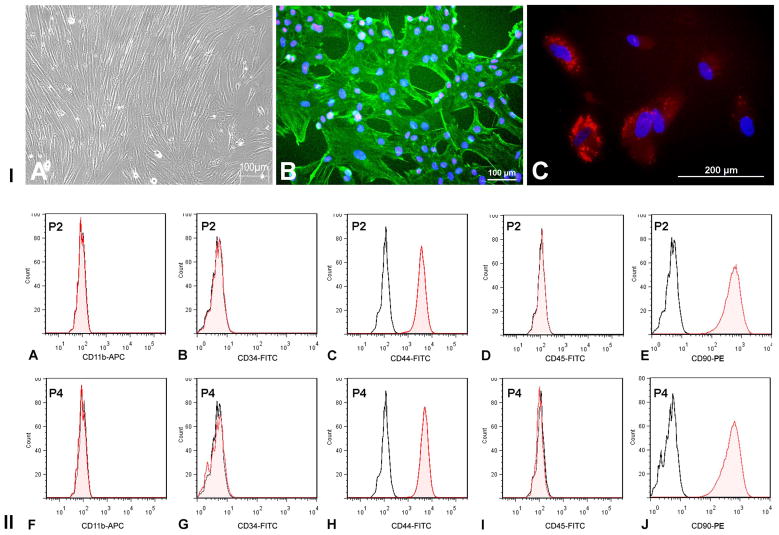
Figure 1. MSC characterization.
I. (A) MSCs showing fibroblastoid morphology in culture (B) Immunostaining of MSCs showing vimentin (green) and C) CD105 (red) staining. Cell nuclei were stained with DAPI. II. Immunophenotyping of MSCs in second (P2) and fourth (P4) passages of culture. Flow cytometry data showing absence of CD11b (A), CD34 (B), CD45 (D), and presence of CD44 (C) and CD90 (E) (MSC markers). The unshaded peak shows the profile of the isotype control. Flow cytometry was done on FACS Aria Flow Cytometry System (BD Biosciences, USA). FITC, APC and PE-labeled IgG (BD Pharmingen, USA) served as isotype controls.

