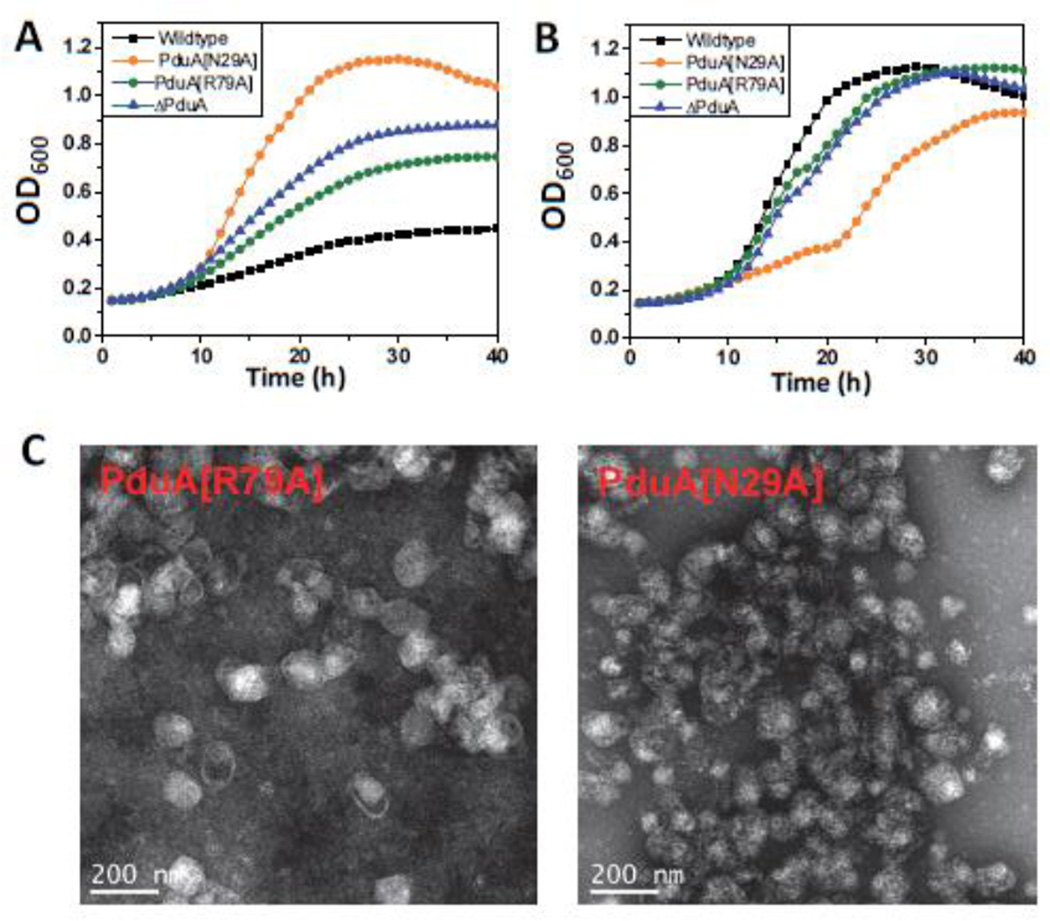
Figure 6. PduA-N29A and PduA-R79A phenotype.
Respective strains were grown on minimal 1,2-PD medium with (A) limiting (20 nM) or (B) saturating (100 nM) CN-B12, respectively. The growth curves were repeated at least three times in duplicate and representative curves are shown. (C) Electron Micrographs of purified PduA-N29A and PduA-R79A MCPs.

